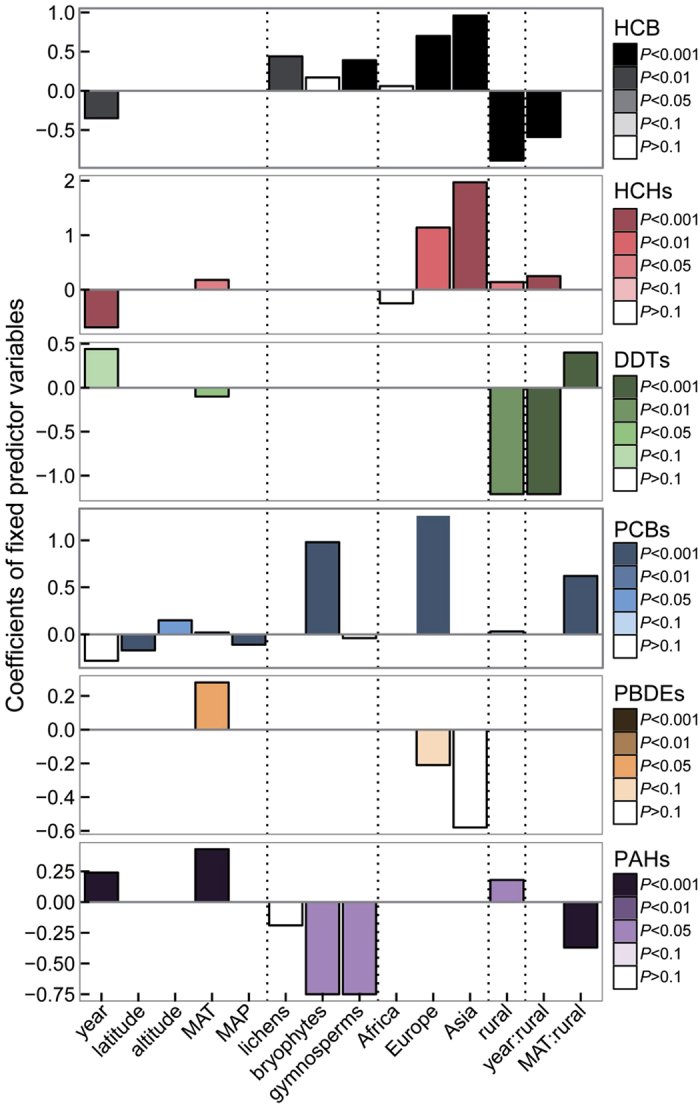
Figure 3. Multilevel model of the selected effects of abiotic and biotic variables on the concentrations of POPs in plants.

Constant and varying effects by congeners are included for the predictor variables included in the lowest-AIC models. All models accounted for spatial correlation structure and nugget (which were significant in all cases, P < 0.001) and were run using the restricted maximum likelihood criterion for optimizing parameter estimates. MAT, mean annual temperature; MAP, mean annual precipitation.
