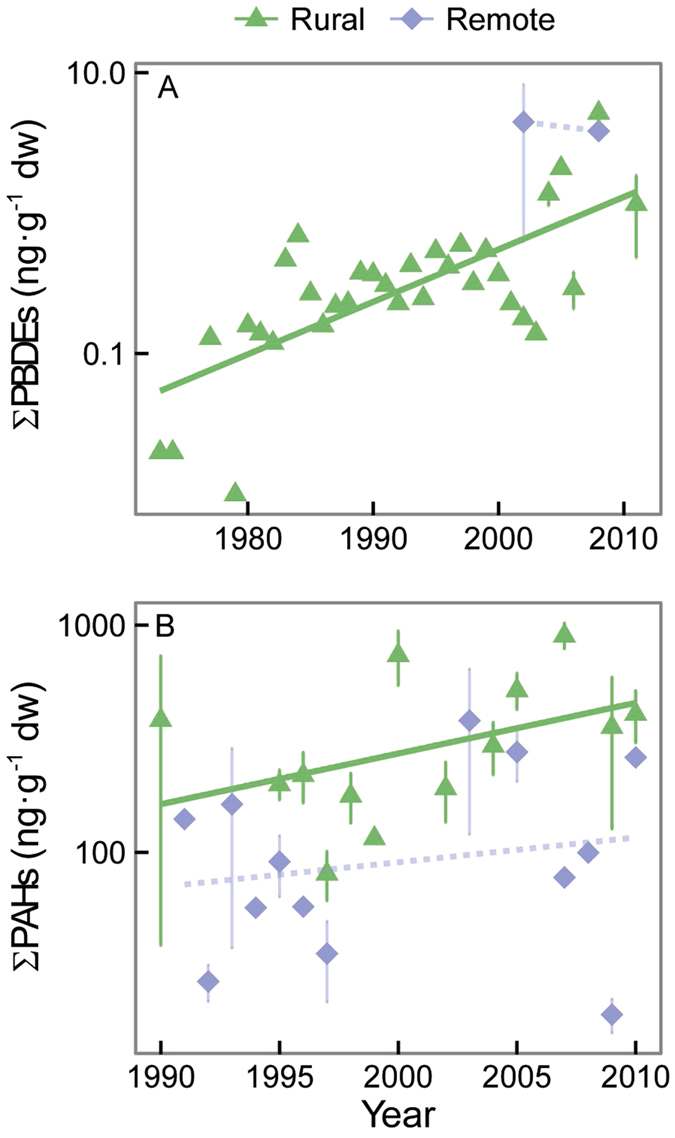
Figure 5. Individual relationships among ΣPBDEs and ΣPAHs (ng·g−1 dry weight) and year.

The equations for rural and remote areas are: (A) ΣPBDEs rural: y = 0.05× − 98, r2 = 0.48, df = 1,91, P < 0.0001, and ΣPBDEs remote: y = 0.03× − 64, r2 = 0.05, df = 1,18, P = 0.3; and (B) ΣPAHs rural: y = 0.06× − 125, r2 = 0.32, df = 1,192, P < 0.0001, and ΣPAHs remote: y = −0.01× + 28, r2 = 0.02, df = 1,47, P = 0.3.
