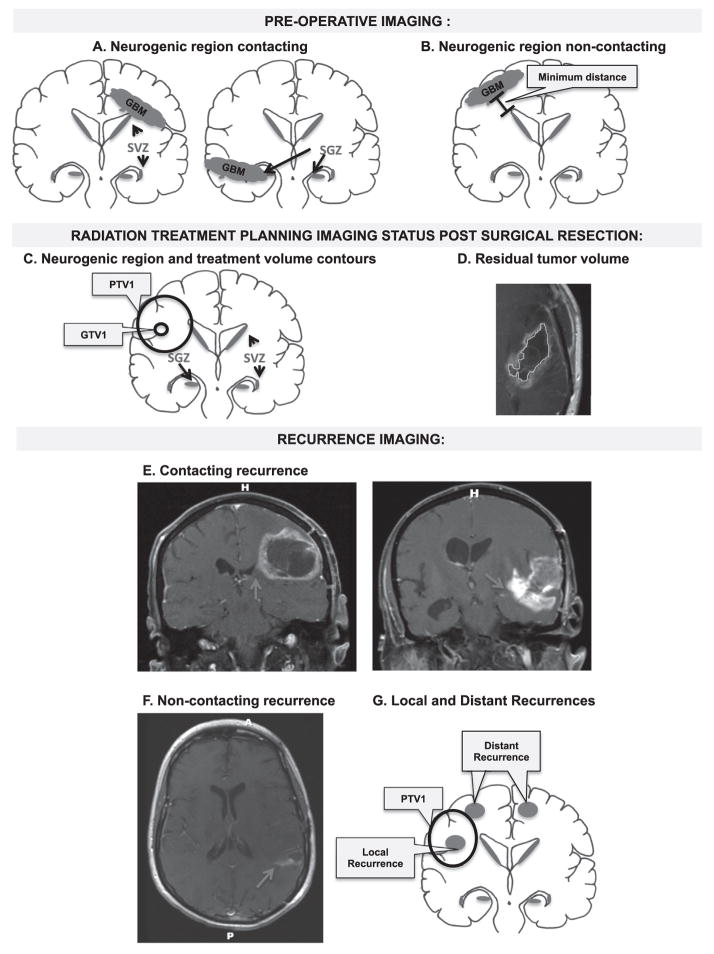
Fig. 1.
Schematic of diagnostic imaging review and methodology. (A and B) Schematic depicts review of GBM imaging at initial diagnosis and neurogenic region contact categorization. GBMs are categorized into SGZ and/or SVZ contacting (A) or non-contacting (B). The minimum distance between the non-contacting GBMs and the nearest neurogenic region was also measured. (C and D) Radiation treatment planning imaging review status post surgical resection. (C) Schematic depicting neurogenic region contours as well as the GTV1 and PTV1 treatment volume contours. (D) Residual tumor volume was also measured by contouring contrast enhancement on T1-weighted MRI post gadolinium and the tumor resection cavity. (E–G). Review of imaging at the time of recurrence and categorization as neurogenic region contacting recurrence, with red arrow denoting contrast enhancement contacting a neurogenic region (E), and non-contacting recurrence (F) on T1-weighted MRI post gadolinium. (F) Also demonstrates an example of asymmetric medial enhancement toward neurogenic region in a recurrent non-contacting GBM. (G) GBM recurrence was also categorized as local or distant based on whether the majority of tumor volume occurred in-field or out-of-field with respect to PTV1.

