Fig. 1.

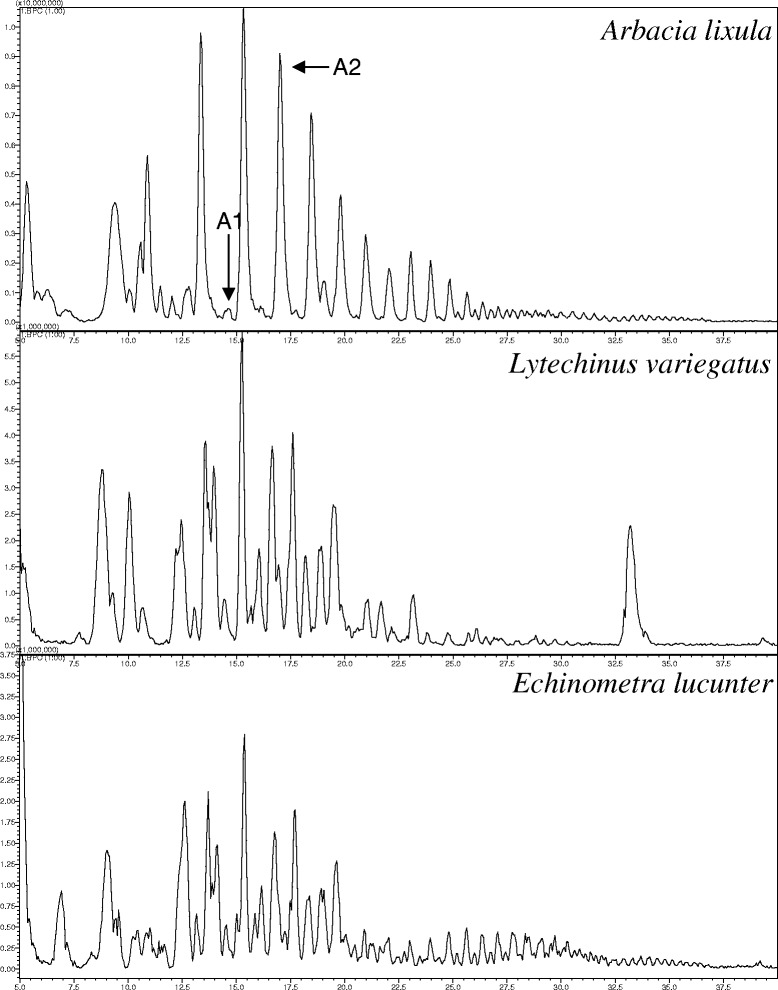
TIC chromatograms of the RP-HPLC analyses of coelomic fluid from 25 % SPE of three sea urchins. A1 and A2 were selected as representative peaks to which complementary analyses are presented in Fig. 3

TIC chromatograms of the RP-HPLC analyses of coelomic fluid from 25 % SPE of three sea urchins. A1 and A2 were selected as representative peaks to which complementary analyses are presented in Fig. 3