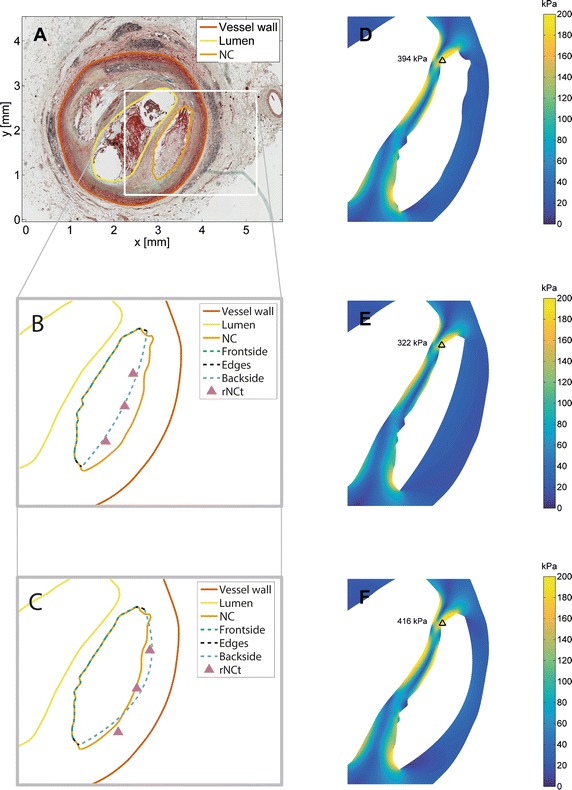
Fig. 4.

From the histology image to stress calculations. A Cross-sectional slice from histology with the vessel wall, lumen, and necrotic core already delineated. B–F are zoomed versions of (A) with necrotic core reconstruction based on the group averaged NC data (B) and with necrotic core reconstruction based on the plaque specific (C) rNCt estimation methods. D–F are the wall stresses of the plaque containing the necrotic core geometry from the ground truth (D), reconstruction of the necrotic core based on group averaged data (E) and reconstruction of the necrotic core based on plaque specific (F) method and the black triangles indicate the location of the peak cap stress
