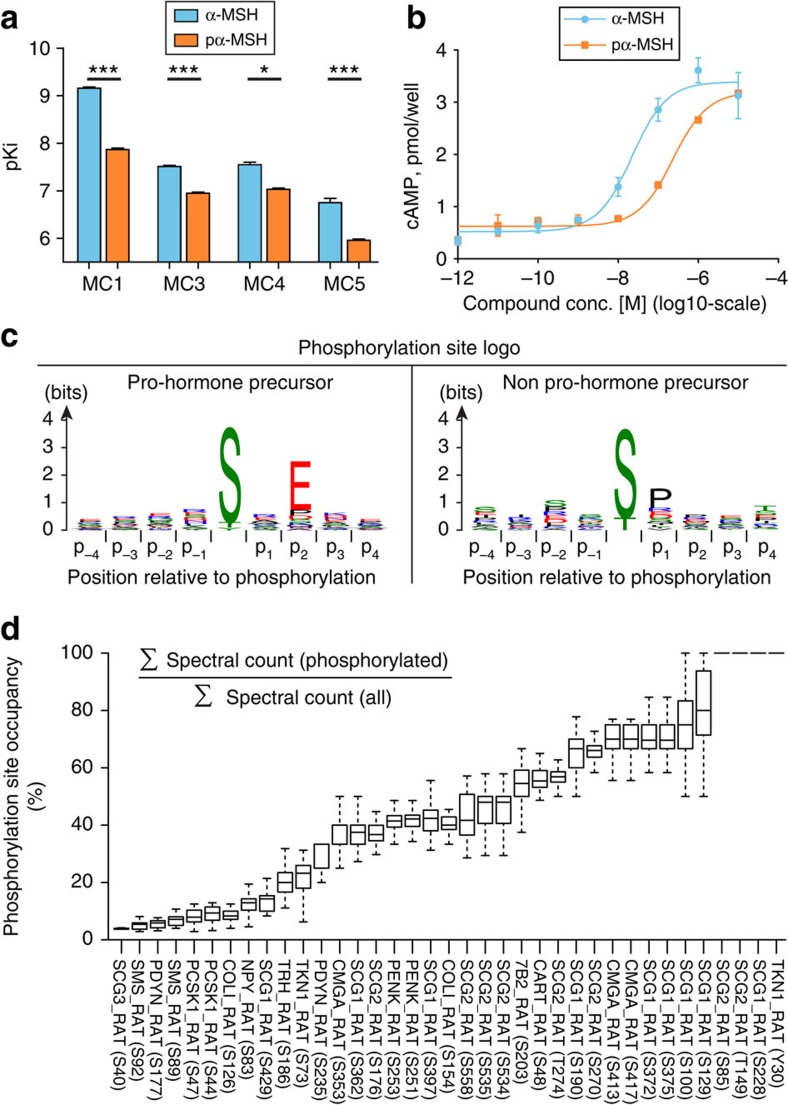
Figure 4. Functional analysis of neuropeptide phosphorylation sites.
(a) Ki (shown as negative log, pKi) calculated from IC50 values determined under equilibrium conditions in competition with 125I-NDP-α-MSH on MC1, 3, 4 and 5 receptors, respectively. (Cheng–Prusoff equation *P<0.05, ***P<0.001). Values are mean±s.e.m. (b) Representative figure of α-MSH and phosphorylated α-MSH-stimulated cAMP production in intact BHK cells expressing the human MC4 receptor. (c) Logo plots of the phosphorylation sites revealed a [ST]xE motif for the neuropeptide protein precursor group. In contrast, a [ST]P motif was found for the remaining phosphopeptides. (d) Occupancy of phosphorylation sites that was observed at least three times. Boxplots depicts variation observed across 32 replicates. Each line contains the Uniprot gene name and phosphorylated position in parentheses.

