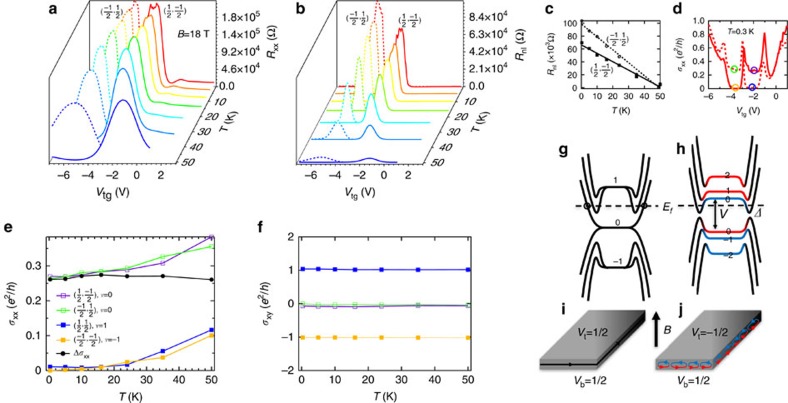
Figure 4. Temperature dependence and illustrative schematics of the QHE and v=0 state in TI.
(a) Rxx and (b) Rnl measured in sample ‘A' as functions of Vtg for different temperatures at B=18 T, where Vbg is chosen to set νb at 1/2 (dashed lines) and −1/2 (solid lines), respectively. (c) The Rnl value at (νt, νb)=(−1/2, 1/2) and (1/2, −1/2) shows approximately linear dependence on temperature. (d) σxx versus Vtg (with the same two values of Vbg chosen in a and b) at T=0.3 K as an example, with each highlighted circle corresponding to a state in e plotted with corresponding coloured symbols. (e) σxx and (f) σxy of ν=+1, −1 and 0 states as functions of temperature. In e, we also plot Δσxx (difference between averaged ν=0 states' σxx and averaged ν=±1 states' σxx), which barely changes with T. (g,h) Schematics of surface band structure (energy spectrum) in high magnetic field, showing LLs from top and bottom surfaces (blue and red) in the middle of the sample transitioning into side surface sub-bands at sample edge, and (i,j) edge states in a slab-shaped sample for ν=1 and ν=0 states. The dashed line indicates a representative Fermi level Ef and circles in g label chiral edge modes.

