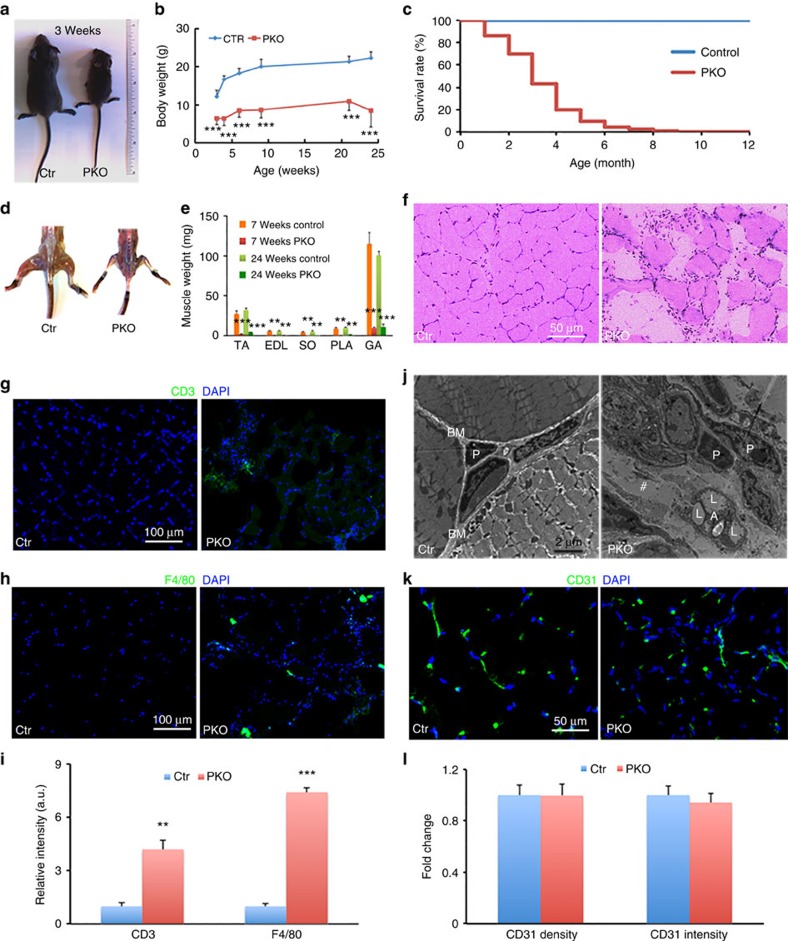
Figure 1. The PKO phenotype.
(a) Size comparison of 3-week-old control and PKO mice. (b) Body weight quantification over time; n=10 for 3–6 weeks, 6 for 9 weeks and 4 for 21–24 weeks. (c) Survival rate of control and PKO mice over time. (d) Hindlimb muscle comparison between control and PKO mice. (e) Quantification of individual hindlimb muscle weight at 7 and 24 weeks; n=5. (f) H&E staining of hindlimb muscles. (g,h) Immunohistochemical analyses of CD3 (g, green) and F4/80 (h, green) infiltration in control and PKO muscles. (i) Quantification of CD3 and F4/80 expression in control and PKO muscles; n=3. (j) Representative ultrastructural images of hindlimb muscles. A, adipocytes; BM, basement membrane; L, lipid droplets; P, pericytes; #, gap. (k) Immunohistochemical analyses of CD31 (green) expression in control and PKO muscles. (l) Quantification of CD31 expression; n=3. Scale bars, 50 μm in f and k; 100 μm in g and h; and 2 μm in j. **P<0.01; ***P<0.001 (Student's t-test). The results are shown as mean±s.d.

