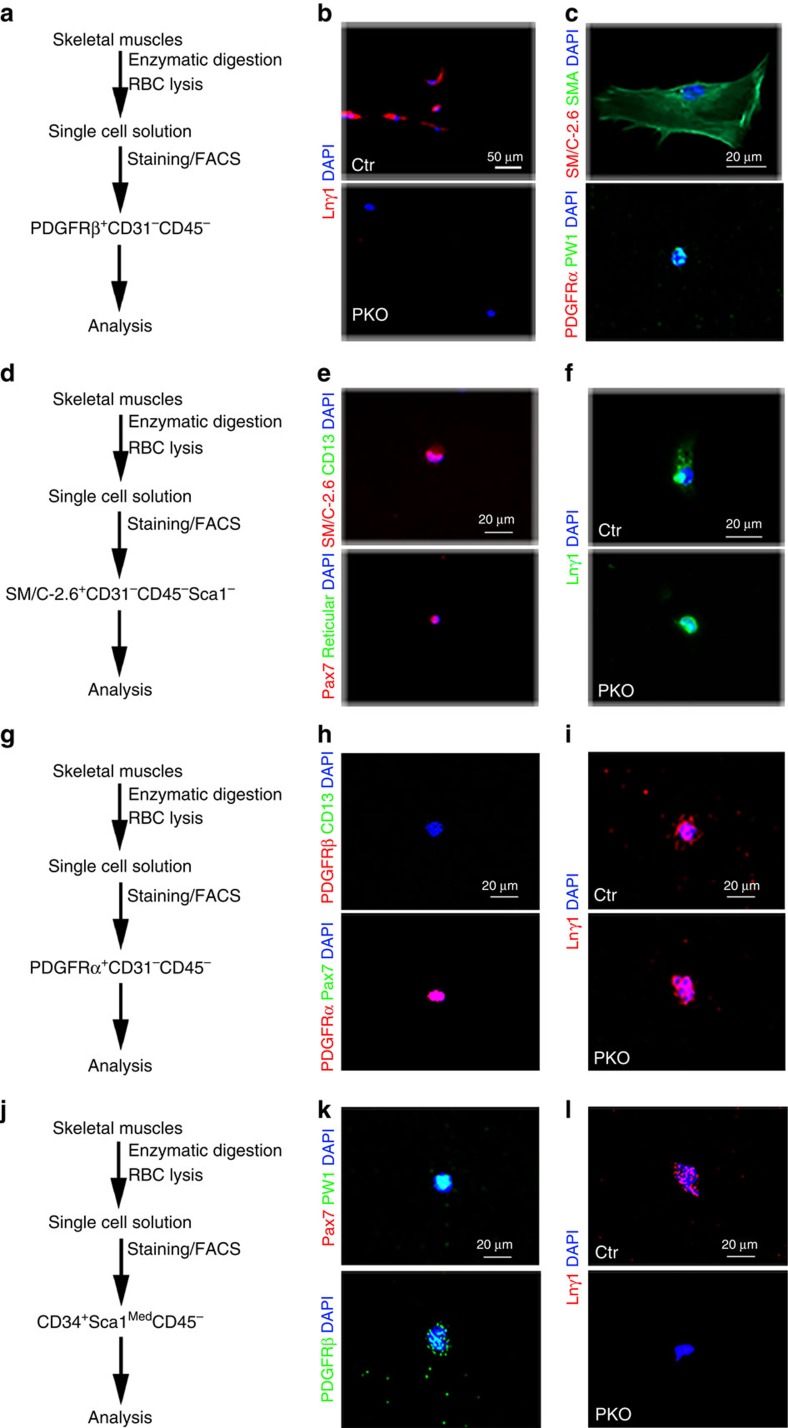
Figure 3. Laminin expression in sorted primary cells.
(a) Schematic illustration of PDGFRβ+ cell-isolating procedure. (b) Laminin γ1 (red) expression in PDGFRβ+ cells isolated from control and PKO mice. (c) SM/C-2.6 (red)/SMA (green) and PDGFRα (red)/PW1 (green) expression in wild-type PDGFRβ+ cells. (d) Schematic illustration of satellite cell-isolating procedure. (e) SM/C-2.6 (red)/CD13 (green) and Pax7 (red)/Reticular (green) expression in wild-type satellite cells. (f) Laminin γ1 (green) expression in satellite cells isolated from control and PKO mice. (g) Schematic illustration of FAP-isolating procedure. (h) PDGFRβ (red)/CD13 (green) and PDGFRα (red)/Pax7 (green) expression in wild-type FAPs. (i) Laminin γ1 (red) expression in FAPs isolated from control and PKO mice. (j) Schematic illustration of PIC-isolating procedure. (k) Pax7 (red)/PW1 (green) and PDGFRβ (green) expression in wild-type PICs. (l) Laminin γ1 (red) expression in PICs isolated from control and PKO mice. Scale bars, 50 μm in b and 20 μm in c,e,f,h,i,k and l.

