Fig. 3.

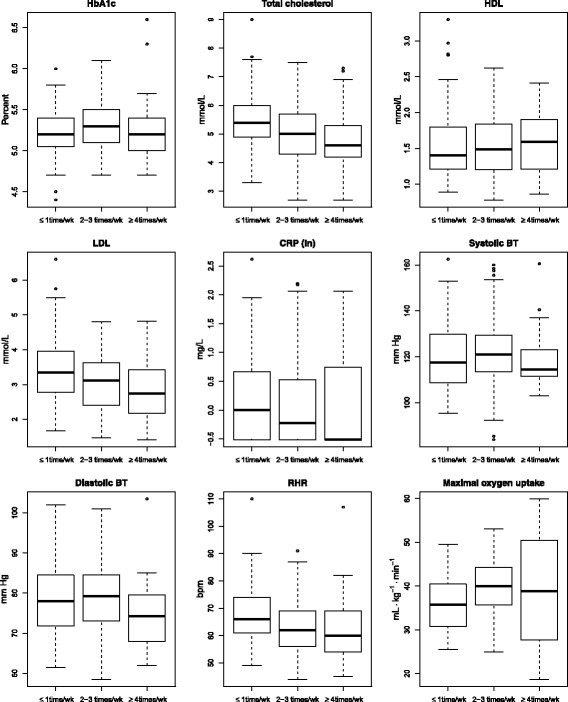
Differences in HbA1c, lipids, CRP, blood pressure, RHR and maximal oxygen uptake according to level of exercise, all measurements at both baseline and follow-up are included

Differences in HbA1c, lipids, CRP, blood pressure, RHR and maximal oxygen uptake according to level of exercise, all measurements at both baseline and follow-up are included