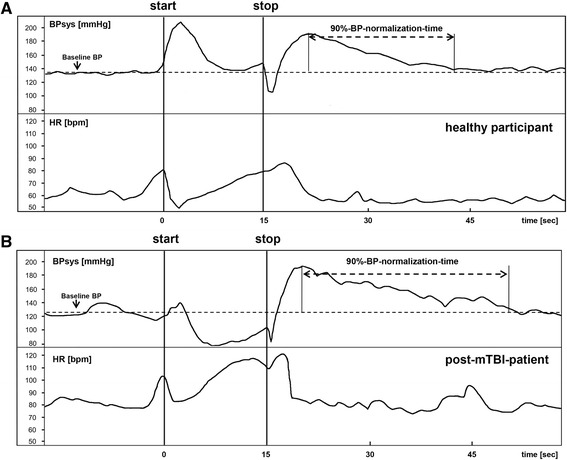
Fig. 1.

Time-series of systolic blood pressure (BPsys) and heart rate (HR) during the Valsalva maneuver. For a healthy participant and a post-mTBI-patient, the double-headed arrows indicate the intervals from the highest systolic blood pressure (BPsys) value after strain to the time when BPsys had fallen by 90 % of the difference between peak-phase-IV BPsys and baseline BPsys, i.e. the 90 %-blood-pressure-normalization-time. “Start” and “stop” refer to the beginning and release of expiratory strain during the Valsalva maneuver
