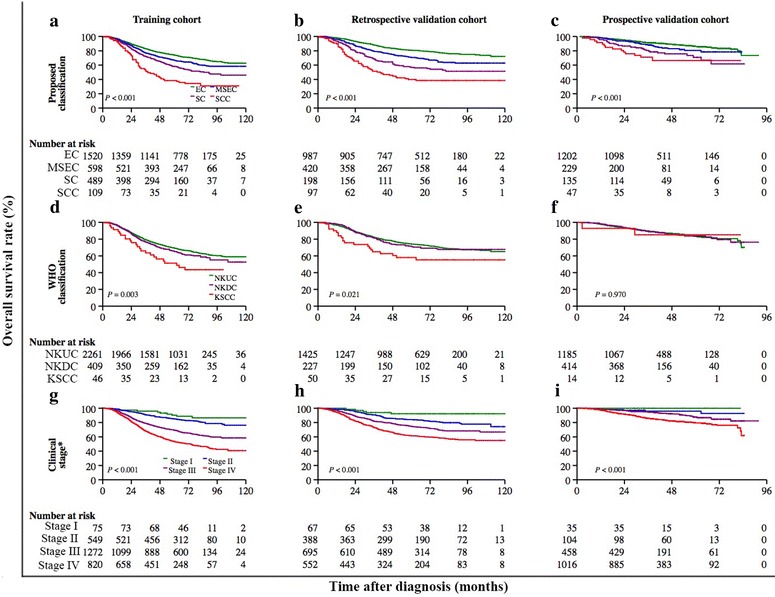
Fig. 3.

Kaplan-Meier curves of OS according to the proposed classification, the World Health Organization (WHO) classification, and clinical stage in NPC patients from the training (n = 2716), retrospective validation (n = 1702), and prospective validation cohorts (n = 1613), respectively. OS curves of patients classified with the proposed classification in the training (a), retrospective validation (b), and prospective validation cohorts (c). OS curves of patients classified with WHO classification in the training (d), retrospective validation (e), and prospective validation cohorts (f). OS curves of patients classified with clinical stage in the training (g), retrospective validation (h), and prospective validation cohorts (i). The log-rank test was used to estimate P values. *The training cohort was classified by the 1992 China staging system; the retrospective validation cohort was classified by the 1992 China staging system or the 1997 American Joint Committee on Cancer (AJCC) staging system; the prospective validation cohort was classified by the 1997 AJCC staging system
