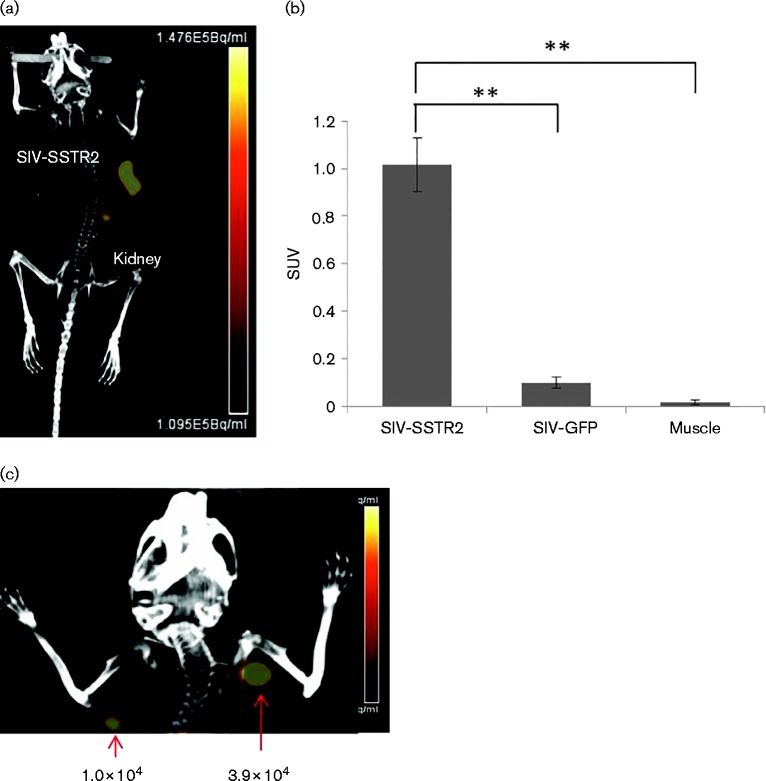
Fig. 5.
PET-CT imaging of HCT116 cells transduced with SIVmac239-GFP-T2A-SSTR2 in vivo. (a) A PET-CT image of a representative mouse transplanted with HCT116 cells transduced with SIVmac239-GFP-T2A-SSTR2 11 days post-transplantation. (b) Standard uptake values (SUVs) were calculated by measuring regions of interest (ROI) from each PET-CT image and compared amongst tumours transduced with SIVmac239-GFP or SIVmac239-GFP-T2A-SSTR2 to muscle. Results are reported as mean ± sd; n = 4; **P < 0.0001. (c) In total, 1 × 10² to 3.9 × 10⁴ HCT116 cells transduced with SIVmac239-GFP-T2A-SSTR2 were transplanted subcutaneously in nude mice and imaged by PET-CT scanning 36 h post-transplantation (only the image of 1.0 × 10⁴ and 3.9 × 10⁴ transplanted cells is shown).

