Fig. 6.
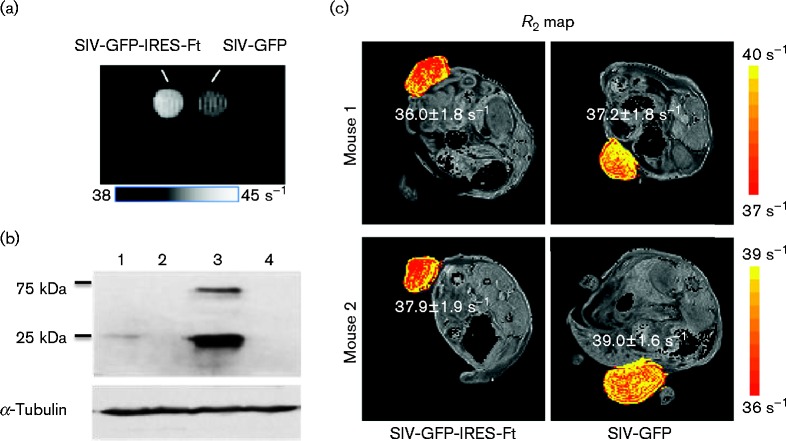
Magnetic contrast by ferritin expression in infected cells in vitro and in vivo. (a) Increased contrast measured by a 9.4 T Varian magnetic resonance scanner in cell pellets of 1 × 10⁶ 293FT cells transduced with SIVmac239-GFP-IRES-Ft (5.5 % infected population) or SIVmac239-GFP (7.1 % infected population). (b) Western blot of 293FT and CEMx174 cells infected with SIVmac239-GFP-IRES-Ft (lane 1 and 3, respectively) or infected with SIVmac239-GFP (lanes 2 and 4, respectively) using antibodies against human ferritin. (c) Two nude mice transplanted with HCT116 cells transduced with SIVmac239-GFP-IRES-Ft were imaged by MRI on day 16 post-transplantation. The R2 values are displayed in a colour scale where yellow pixels indicate high R2 values with the mean R2 values shown next to tumours.

