Fig. 7.
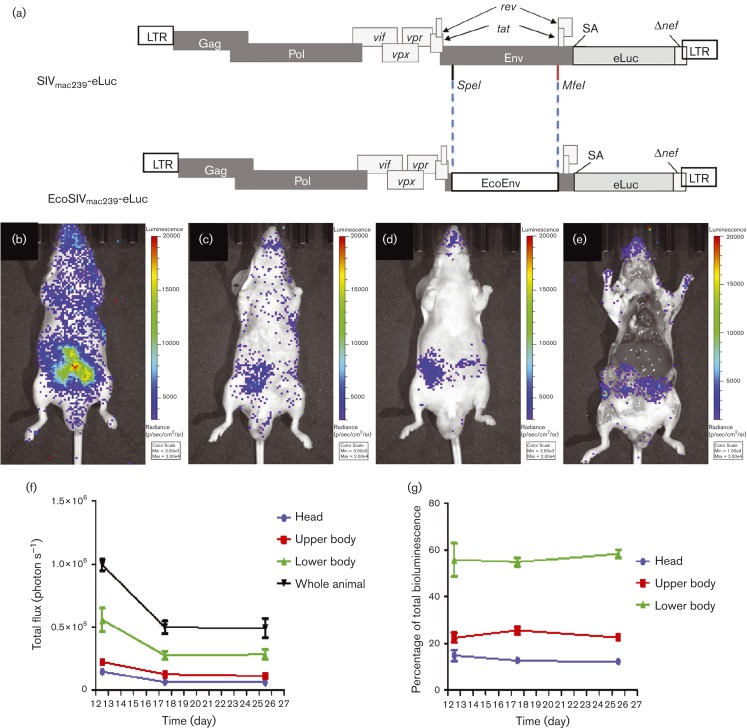
Visualization of EcoSIV infection in vivo. (a) EcoSIVmac239-eLuc was engineered with the envelope from ecotropic MLV in the position of SIV gp120.SA, splice acceptor. (b–d) Mice were inoculated with EcoSIV carrying eLuc (EcoSIVmac239-eLuc) via intraperitoneal injection, and imaged at 12 (b), 17 (c) and 25 days p.i. (d). (e) Following imaging on day 25, mice were euthanized and the organs were exposed to show localized bioluminescence from infected cells. Images are scaled equally in radiance units (see Methods); n = 4. (f) Total flux of radiance from each portion of the body was plotted against the time points p.i. to illustrate the dynamics of infected cells in each portion of the body and the whole body over time. (g) The biodistribution of infected cells in each portion of the body was constant over time.

