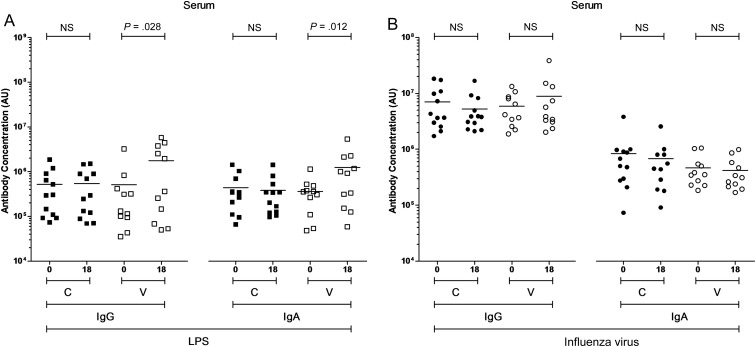
Figure 1.
Levels of serum immunoglobulin G (IgG) and immunoglobulin A (IgA) to specific antigens. The levels of IgG and IgA specific to Salmonella Typhi lipopolysaccharide (LPS; A) and influenza virus (B) in serum, expressed in arbitrary units (AU). For control (C; closed squares and circles) and vaccinated (V; open squares and circles) volunteers, paired comparisons were made between day 0 and day 18 values. Horizontal bars represent mean values (paired t tests were performed using logarithmically transformed data). Abbreviation: NS, not significant.

