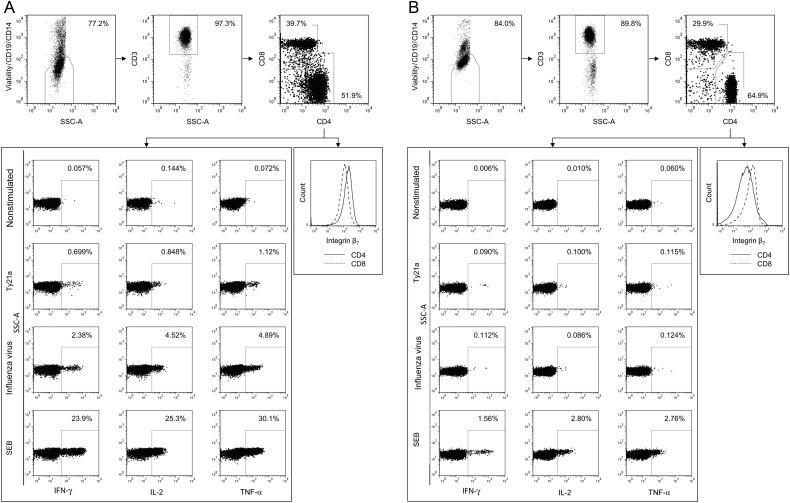
Figure 2.
Representative flow cytometric gating strategy. Dot plots are shown for cells isolated from the duodenal mucosa (A) and peripheral blood (B). Dead cells, B cells, and monocytes were removed by staining for viability (Vivid), CD19, and CD14 and gating on the negative population. T cells were identified according to the expression of CD3. T cells were classified according to the expression of CD4 and CD8 and the expression of interferon γ (IFN-γ), tumor necrosis factor α (TNF-α), and/or interleukin 2 (IL-2) assessed in nonstimulated and in live-attenuated Salmonella Typhi strain Ty21a (Ty21a)-, influenza virus–, and staphylococcal enterotoxin B (SEB)–stimulated samples.

