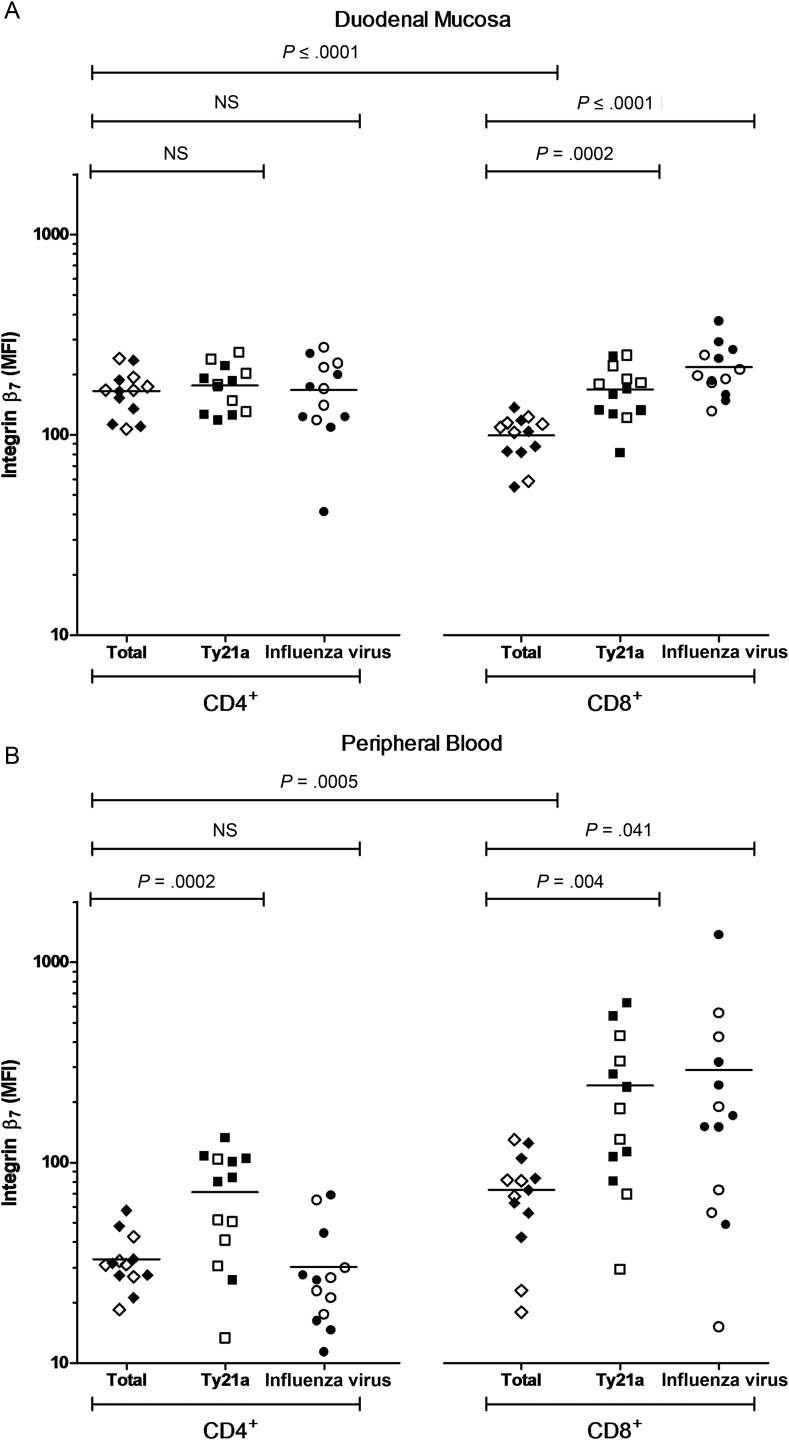
Figure 5.
Integrin β7 expression intensity among T-cell populations at day 18. Geometric mean fluorescence intensity (MFI) expression of integrin β7 among nonstimulated total CD4+ and total CD8+ T-cell populations (control volunteers, closed diamonds; vaccinated volunteers, open diamonds) and in live-attenuated Salmonella Typhi strain Ty21a (Ty21a)-stimulated (control volunteers, closed squares; vaccinated volunteers, open squares) and heterologous influenza virus–stimulated (control volunteers, closed circles; vaccinated volunteers, open circles) cytokine-producing subpopulations. Measurements were made at the duodenal mucosa (A) and in peripheral blood (B). Horizontal bars represent mean values (comparisons were made using unpaired t tests). Abbreviation: NS, not significant.

