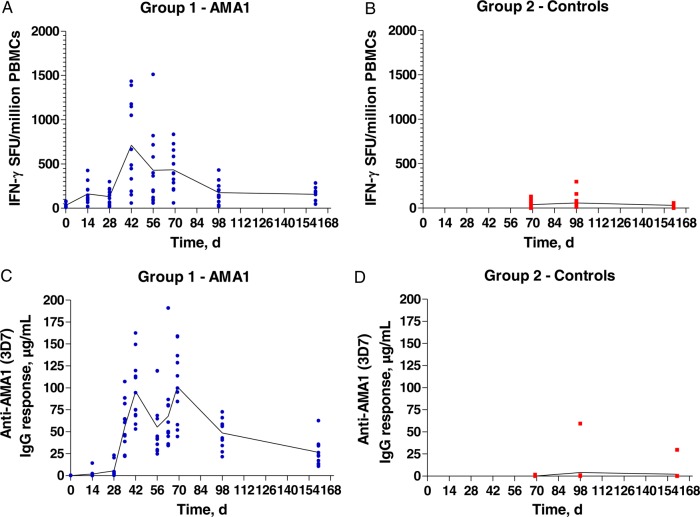
Figure 2.
T-cell and antibody responses in vaccinees and controls. A and B, T-cell responses were assessed in each group by ex vivo interferon γ (IFN-γ) enzyme-linked immunospot analysis, using fresh peripheral blood mononuclear cells (PBMCs). C and D, Serum anti–apical membrane antigen 1 (AMA1; 3D7) immunoglobulin G (IgG) responses were assessed in Oxford for each group by an enzyme-linked immunosorbent assay. Mean and individual responses are shown over time. Blood-stage controlled human malaria infection took place on day 70. Abbreviation: SFU, spot-forming units.

