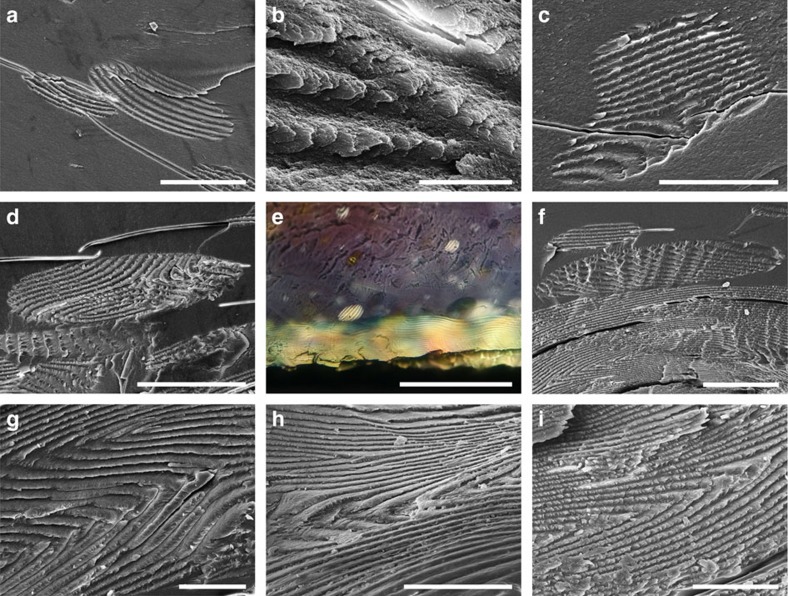
Figure 6. Fusion of tactoids and formation of defects.
(a) SEM image depicting the initiation of fusion between two tactoids. (b) SEM image of the fusion point shown in a at a higher magnification. (c,d) ‘Hybrid tactoids' formed by the fusion of several individual ones. (e,f) POM and SEM images illustrating the sedimentation of CNC tactoids to the lower part and the formation of continuous layers at the bottom of the suspension. Tactoid fusion defects that persist in continuous layers are shown in SEM images (g,h and i). Evaporation time and estimated CNC concentration for these images are as follows: (a,b) 9 h, 4.6 wt%; (c–i) 12 h, 4.9 wt%. Scale bars, (a) 50 μm, (b) 5 μm, (c,d) 50 μm, (e) 200 μm, (f) 50 μm and (g–i) 20 μm.

