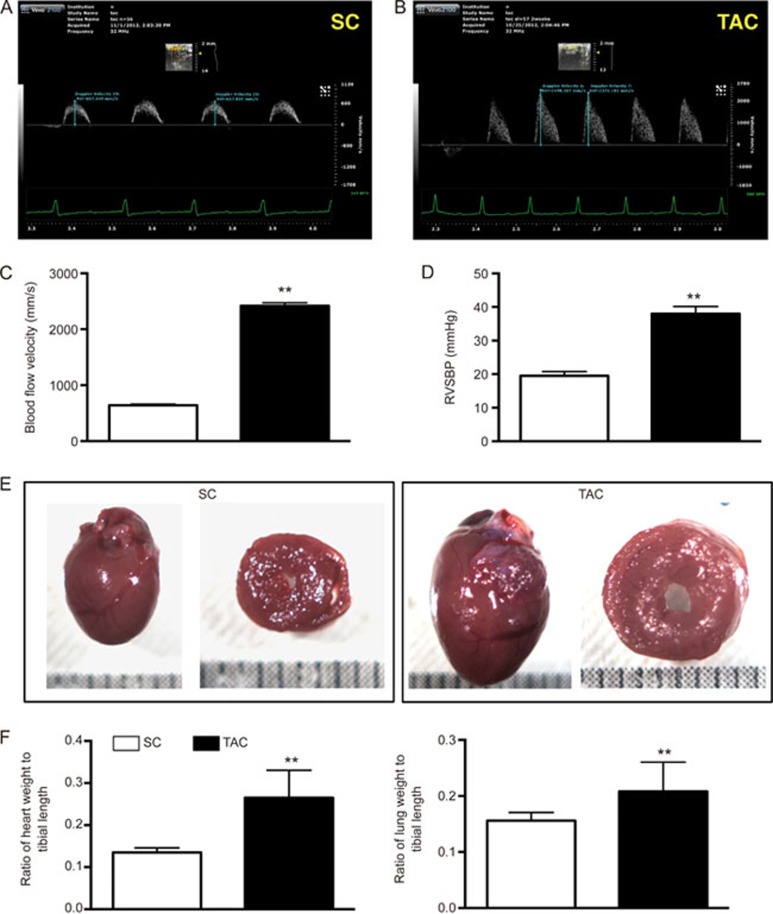
Figure 1.
Results of the pilot study. (A & B) The Doppler results of blood flow velocity of the ascending aorta 2 weeks after the transverse aortic constriction (TAC) procedure. (C) Analytical results of blood flow velocity at the ascending aorta. (D) Right ventricular systolic blood pressure (RVSBP) at day 60 after TAC procedure. (E) The gross anatomical finding of the appearance of the whole heart and a cross section of the heart at the papillary level. Notably larger size of the whole heart and left ventricular hypertrophy (ie, from cross section) were observed in TAC animals compared with sham control (SC) animals. (F) The ratio of heart weight to tibial length. (G) The ratio of lung weight to tibial length. Mean±SEM. n=6 for each group. **P<0.01 vs TAC group.

