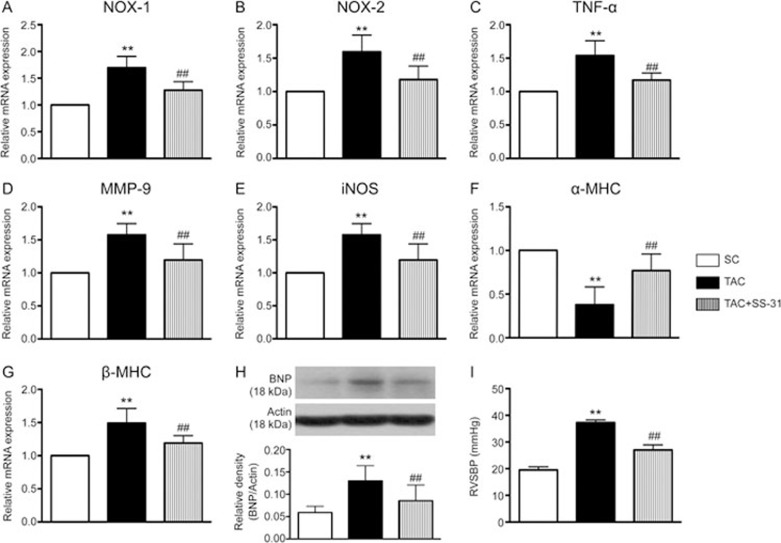
Figure 2.
Gene and protein expression levels and RVSBP on day 60 after the TAC procedure. (A) mRNA expression of NOX-1. (B) mRNA expression of NOX-2. (C) mRNA expression of tumor necrosis factor (TNF)-α. (D) mRNA expression of matrix metalloproteinase (MMP)-9. (E) mRNA expression of inducible nitric oxide synthase (iNOS). (F) mRNA expression of α-myosin heavy chain (MHC). (G) mRNA expression of β-MHC. (H) Protein expression of brain natriuretic peptide (BNP). (I) Analytical results of RVSBP. All statistical analyses were performed using one-way ANOVA followed by Bonferroni multiple comparison post hoc test. SC=sham control. TAC=transverse aortic constriction. Mean±SEM. n=6 for each group. **P<0.01 vs SC group. ##P<0.01 vs TAC group.

