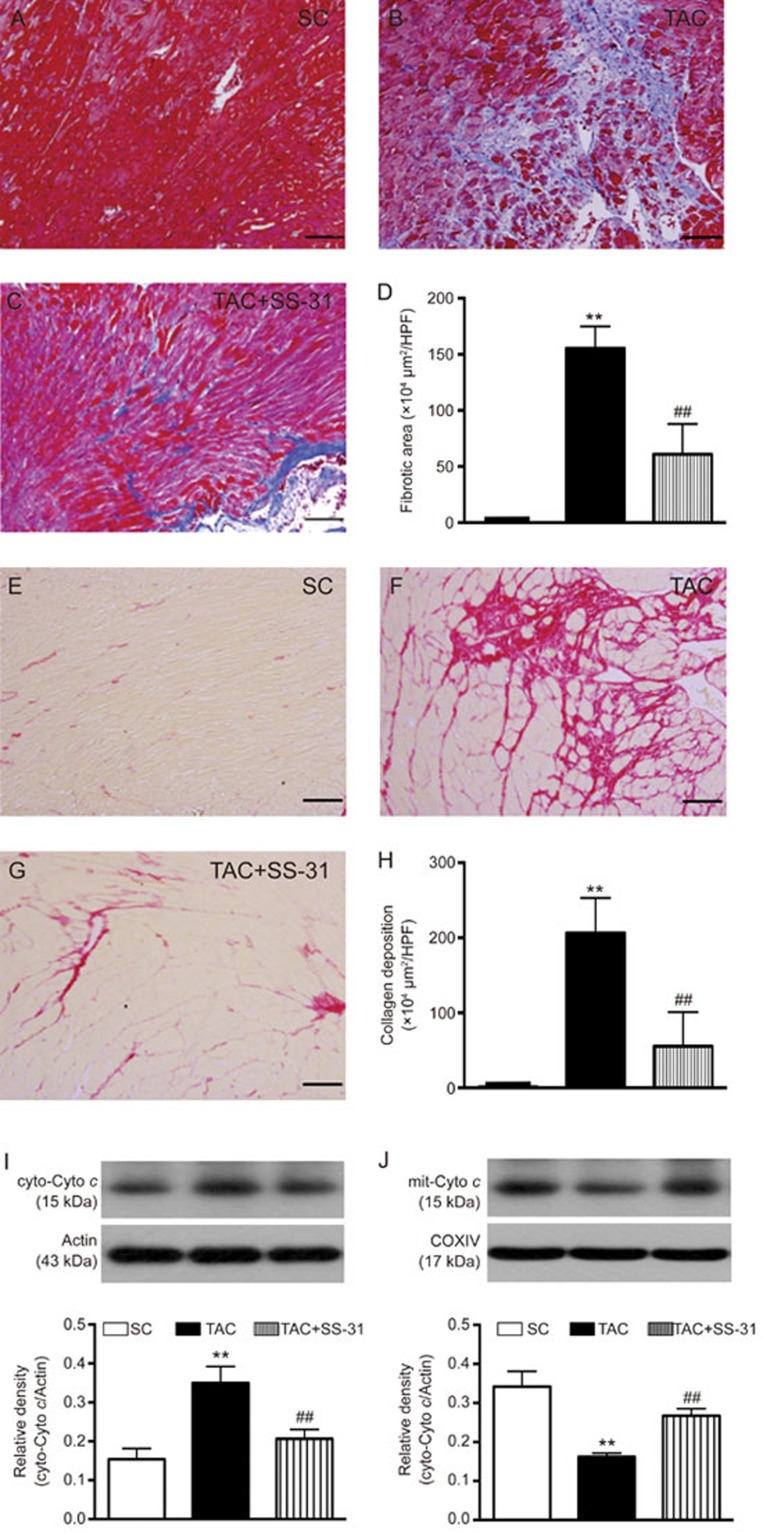
Figure 3.
Histopathological changes and protein expression levels of cytochrome c of the right ventricle on day 60 after the TAC procedure. (A–C) Microscopic observation of Masson's trichrome staining for the identification of fibrotic area (×100). (D) Analytical result of fibrotic area. The scale bars in the right lower corner represent 100 μm. (E–G) Microscopic observation of Sirius red staining for identifying the collagen deposition area. (H) Analytical result of fibrotic area. The scale bars in the right lower corner represent 100 μm. (I) Protein expression of cytosolic cytochrome c (cyt-Cyto c). (J) Protein expression of mitochondrial cytochrome c (mit-Cyto c). All statistical analyses were performed using one-way ANOVA followed by Bonferroni multiple comparison post hoc test. SC=sham control. TAC = transverse aortic constriction. HPF=high-power field. Mean±SEM. n=6 for each group. **P<0.01 vs SC group. ##P<0.01 vs TAC group.

