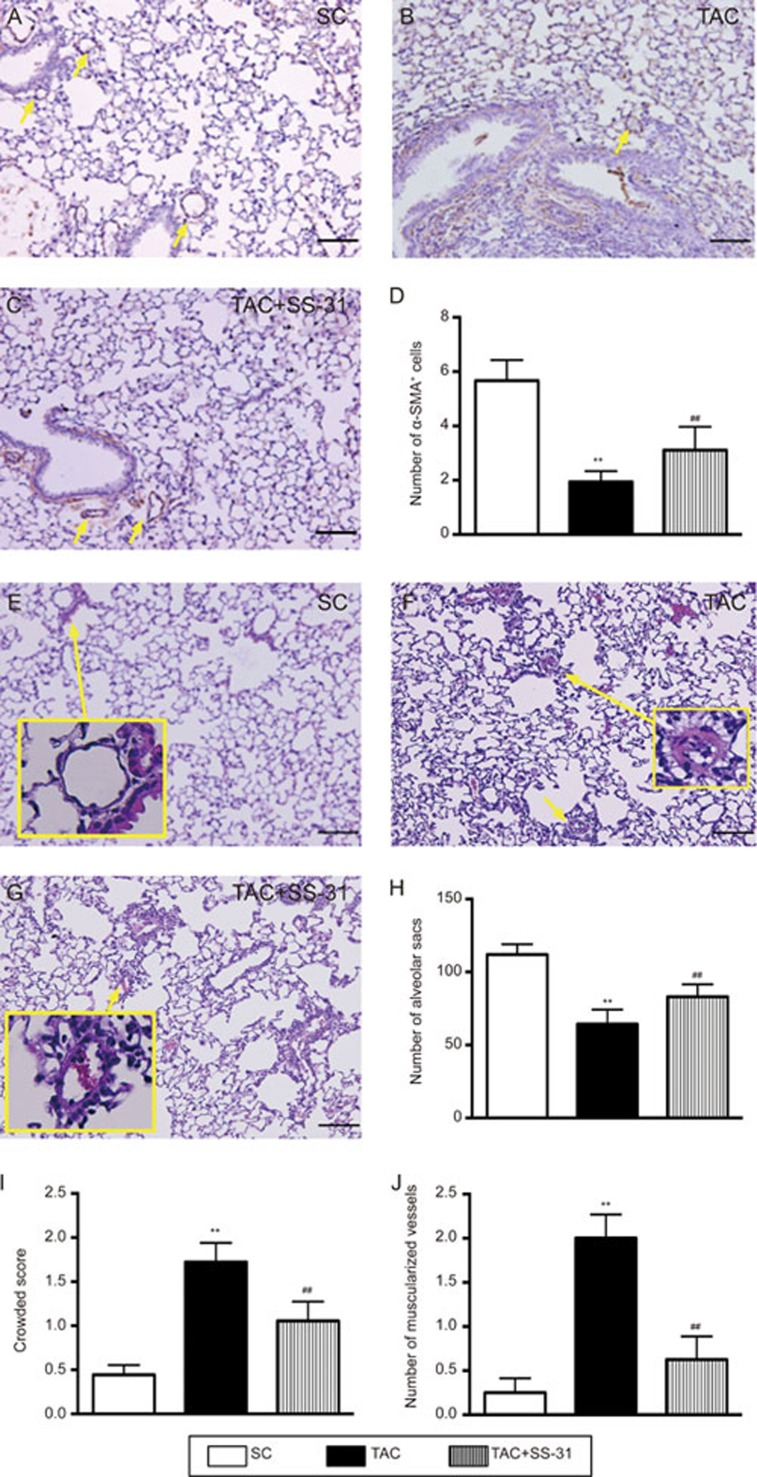
Figure 4.
Histopathological findings in lung parenchyma at day 60 after the TAC procedure. (A–C) Microscopic findings of α-smooth muscle actin staining in a lung section for the identification of the number of small vessels ≤15 μm (yellow arrows) (×100). (D) Analytical results of the number of small vessels. The scale bars in the right lower corner represent 100 μm. (E–G) Microscopic findings of H & E staining in lung sections (×100). The solid-line square indicates the manifestation of the muscle layer of the pulmonary arteriole (PA). The appearance of muscularization of PA in TAC animals was remarkably more prominent than that in SC and TAC animals treated with SS-31. (H) Analytic results of the number of alveolar sacs. (I) Analytic results of crowded score. (J) Analytical results of the number of muscularized pulmonary arterioles. The scale bars in the right lower corner represent 100 μm. All statistical analyses were performed by one-way ANOVA followed by Bonferroni multiple comparison post hoc test. SC=sham control. TAC=transverse aortic constriction. Mean±SEM. n=8 for each group. **P<0.01 vs SC group. ##P<0.01 vs TAC group.

