
Figure 3.
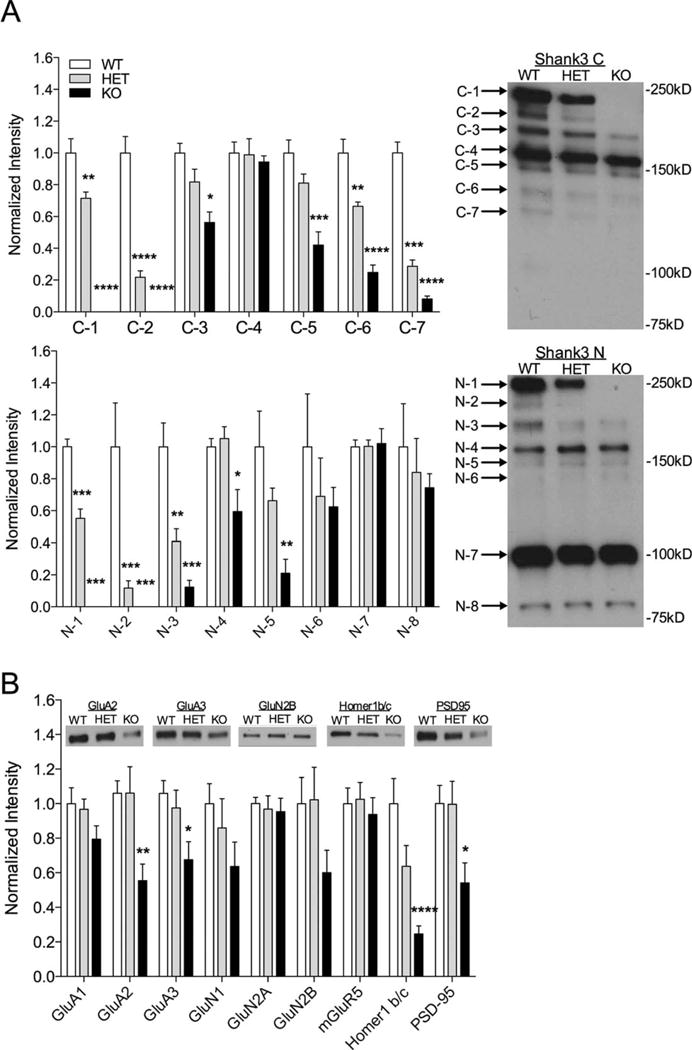
Striatal synaptosome analysis in Shank3e4–9 mutant mice. (A) Quantification and representative Western blots of striatal synaptosomes with C-terminal Shank3 antibody (top) and N-terminal Shank3 antibody (bottom). There is complete loss of the C-1, C-2, N-1, and N-2 bands of Shank3 using Shank3 C and N antibodies in Shank3e4–9 KO mice and significant decrease in same bands in HET mice compared to WT. Significant decreases are also observed in HET and KO mice for C-5, C-6, C-7, and N-3 and in KO mice only for C-3, C-5, N-4, and N-5 (*P < 0.05, **P < 0.01, ***P < 0.001 as indicated, n = 6) (B) Quantification of other synaptic proteins from striatal synaptosomes shows significant decreases in GluA2, GluA3, Homer1 b/c, and PSD95 in Shank3e4–9 KO mice. For each analysis, data were normalized to β-actin levels and then to the average of WT. Representative blots are shown inset for proteins showing significant differences. (*P < 0.05, **P < 0.01, ***P < 0.001, n = 11 WT, 11 HET, 12 KO).