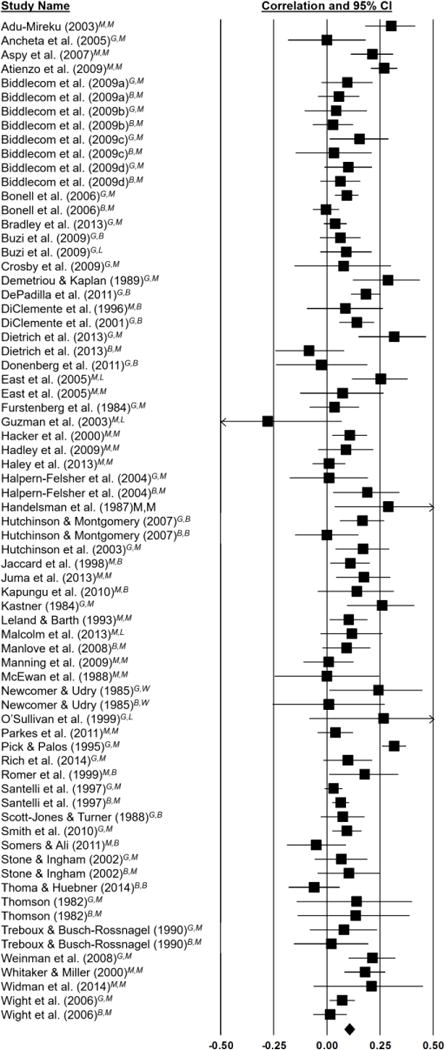
Figure 2.

Forest displaying 71 independent effect sizes and 95% confidence intervals.
Note: Each study is followed by two letters: the first represents the gender of the sample (M=mixed, G=all girls, B=all boys), and the second represents the race/ethnicity of the sample (M=mixed, W=White, B=Black, L=Latino). The diamond indicates the overall weighted mean effect across all studies (r=.10, p<.001).
