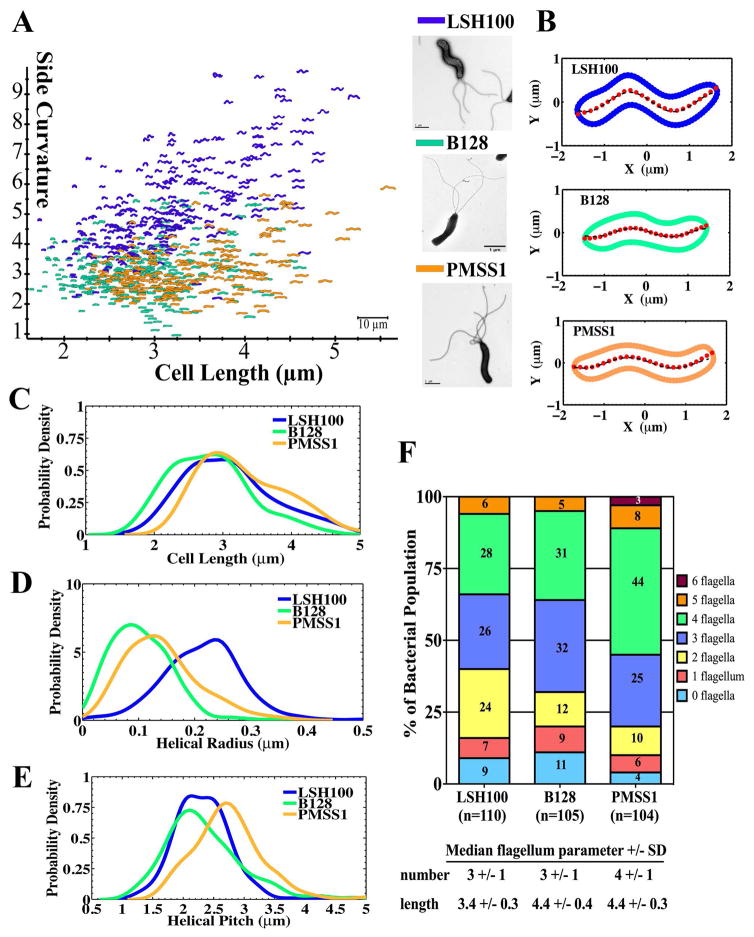
Figure 2. Wild-type H. pylori strains display diverse cell shape and flagellum morphologies.
(A) Side curvature vs. cell length (μm) for individual bacterial cells imaged using phase contrast microscopy of LSH100 (blue, n=282), B128 (green, n=274), and PMSS1 (orange, n=222) bacteria. Inset panel: TEM images of each. Scale bar = 1 μm. Data combined from two independent cultures for each strain. (B) Representative bacterial centerlines (red dots) for each wild-type strain fitted with a generalized sine function, (black dashed line); R, helical radius; P, helical pitch; δ, phase shift term (δ ≈ π for the bacteria shown). (C–E) Smooth histograms of probability density for cell length (μm) (C), helical radius (μm) (D), and helical pitch (μm) (E) of LSH100 (n=262), B128 (n=272), and PMSS1 (n=215) bacteria. (F) Flagellum number counts measured from SEM or TEM images reported as percent of the total bacterial population examined (n=104–110 bacteria).

