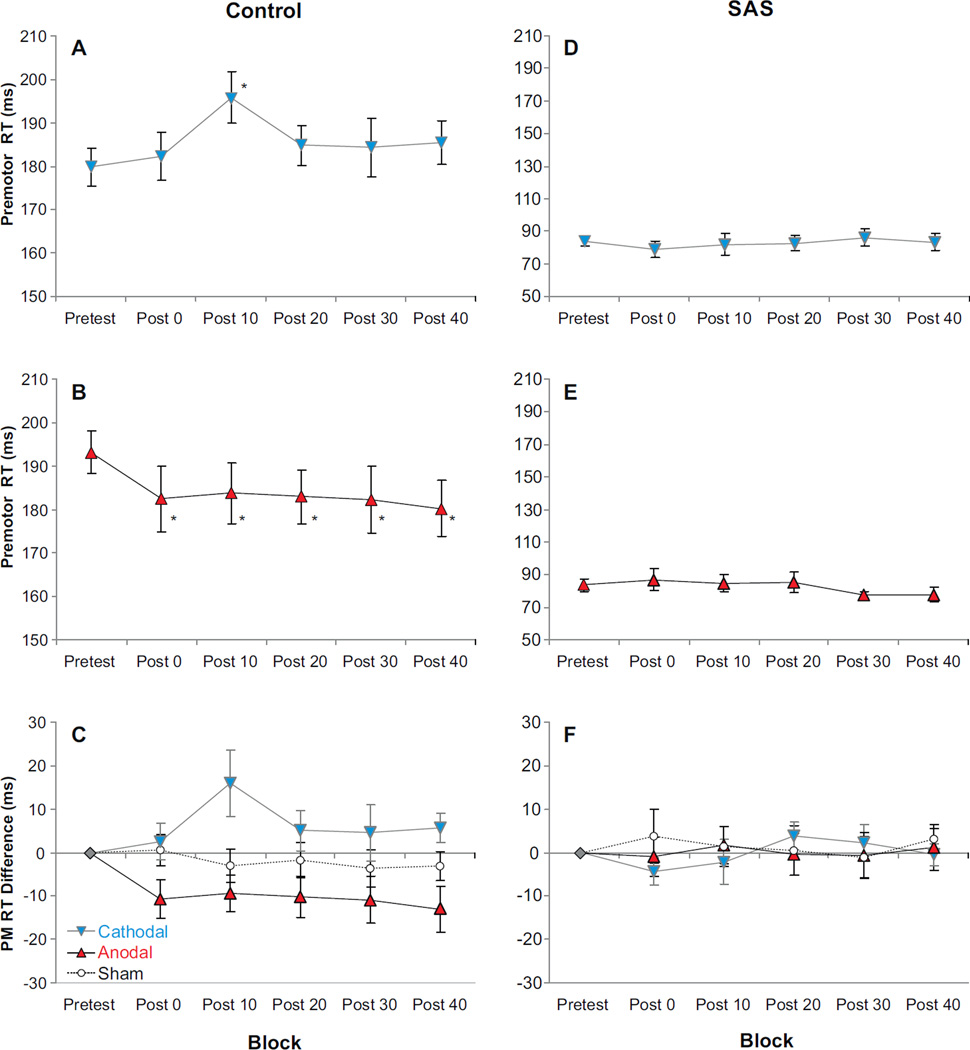
Fig. 1.
Mean (±SE) premotor reaction time (PMRT) observed for each tDCS polarity between blocks and auditory stimulus type (gray/blue = cathodal stimulation; black/red = anodal stimulation; white circles/dashed lines = sham stimulation). Panels A–C show PMRT observed in control trials, while panels D–F show PMRT observed in trials where a startling acoustic stimulus (SAS) was presented. Panels C and F show PMRT difference compared to pretest for anodal, cathodal, and sham stimulation. Panels A, B, D, and E show absolute PMRT for active tDCS sessions (significant PMRT differences of p < .05 between pretest and post-tests are marked with *). (For interpretation of the references to color in this figure legend, the reader is referred to the web version of this article.)

