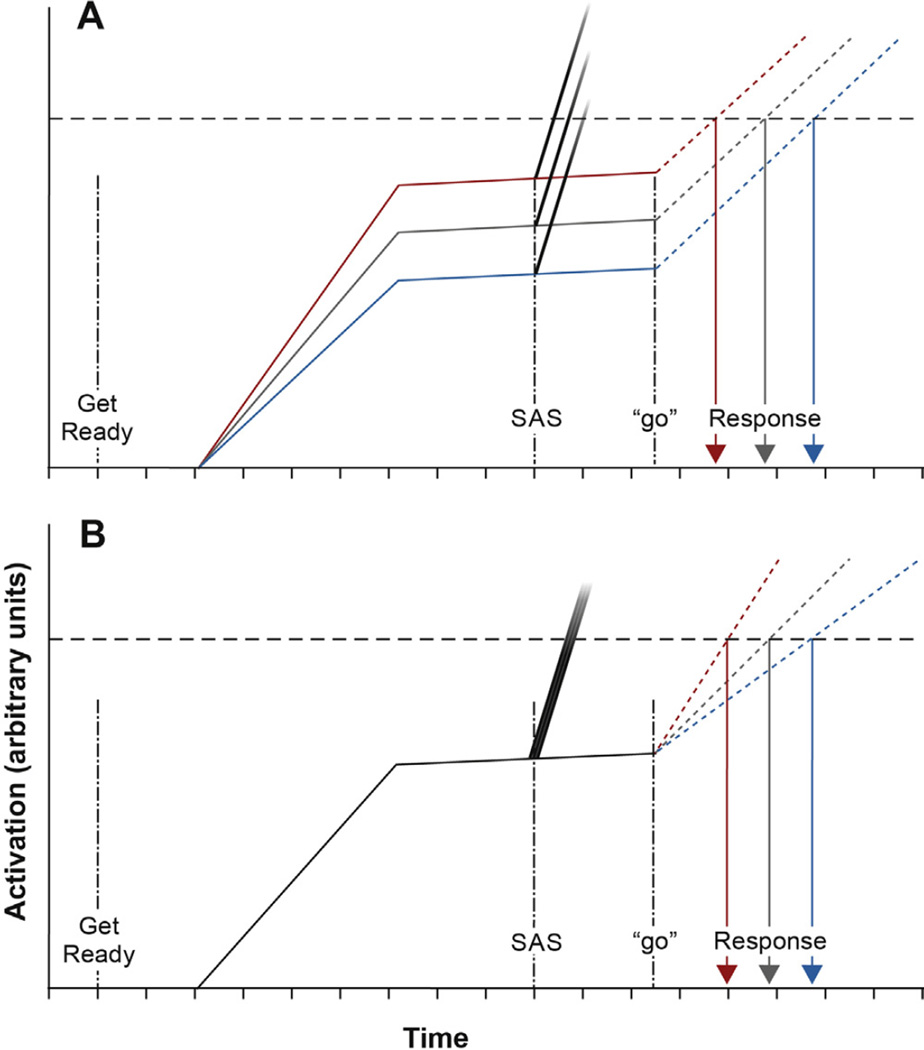
Fig. 4.
Schematic model of preparation and initiation-related neural activity with respect to a fixed threshold (horizontal dashed line) occurring with increasing time after a warning signal (“get ready”). Mean activation related to preparation is represented by solid lines, while activation related to initiation following a “go” signal is represented by dotted lines. Dark gray = activation in pretest. Black/red = activation following anodal tDCS. Light gray/blue = activation following cathodal tDCS. Fading grayscale lines represent activation in response to a startling acoustic stimulus (SAS), and the probability of the activation reaching a given amplitude is represented by the darkness of the gradient at that amplitude (darker = higher probability of seeing activation at that level). Panel A shows expected differences in response time and early response incidence if tDCS affected level of preparatory activation. Panel B shows expected differences if tDCS affected rate of initiation activation. (For interpretation of the references to color in this figure legend, the reader is referred to the web version of this article.)

