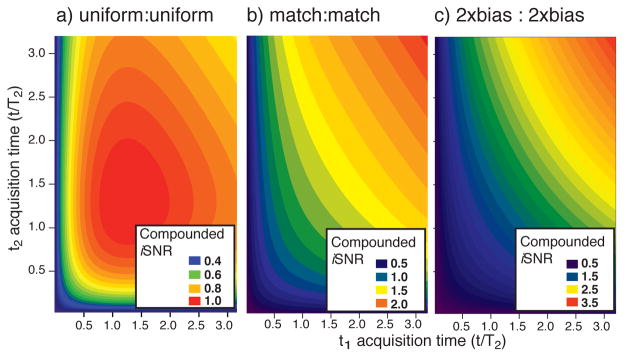
Figure 3.
Representative contour plots delineate the achievable iSNR in nD-NMR when (a) US is applied in each of two indirect dimensions and (b–c) NUS is applied in each of two indirect dimensions as a function of acquisition time. Notice the rather steeply decreasing iSNR when both indirect dimensions are sampled by US. In contrast panel (b) shows the iSNR when a matched exponential sampling bias is applied in each indirect dimension, and panel (c) shows the iSNR for employing 2x exponentially biased NUS in each indirect dimension. Values are scaled such that uniform acquisition to 1.26 T2 in both indirect dimensions has a iSNR of 1.

