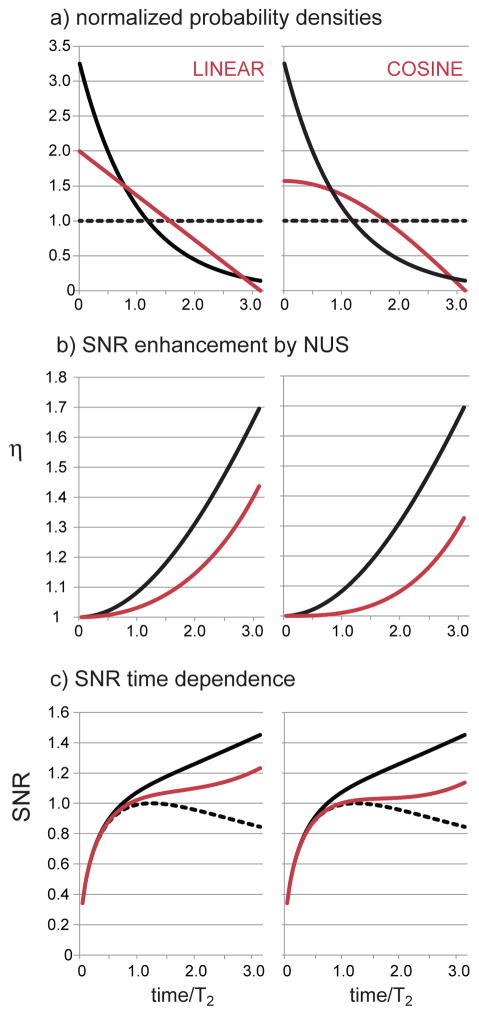
Figure 5.
NUS probability densities following a line and a cosine are analyzed following the same procedure as illustrated for exponential sampling in Figure 1. In all panels, the behavior of matched exponential NUS is given by the solid black line for comparison, while uniform sampling is described by the dashed black line. In (a) the linear and cosine densities have been normalized to have the same area as uniform sampling; the value of χ is given by equation 10b or 11b. In (b) the iSNR NUS enhancements over US as given by equations 10c or 11c are illustrated. In (c) the direct iSNR is obtained by multiplying the enhancement in equation 10c (sinusoid) or 11c (Gaussian) by the iSNR of uniform sampling in equation 1.

