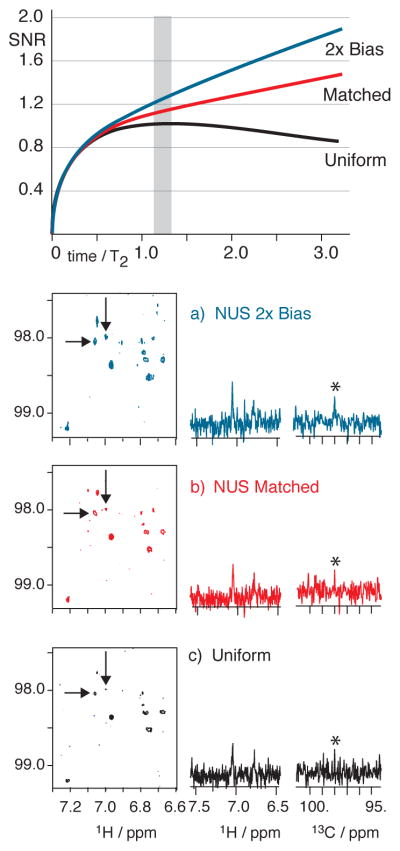
Figure 7.
1H(13C) HSQC spectra of 9 mg natural product spanning an evolution time of about 1.3 T2. Very little improvement occurs for either matched or two-fold biased NUS as seen in panels (a–c): 3 hrs each, NUS selecting 160 of 640 uniform samples. (US: 4 transients per sample; NUS:16 per sample). Contour levels are consistent in (a–c). All NUS spectra processed by MaxEnt. The iSNR in (a–c) was adjusted by mis-setting pulse lengths so that signals by US would be at the limit of detectability; thus the very slight improvement in the ability to distinguish signals by NUS reflects the small iSNR improvement by NUS for evolution times spanning 1.3 T2. (shaded vertical bar)

