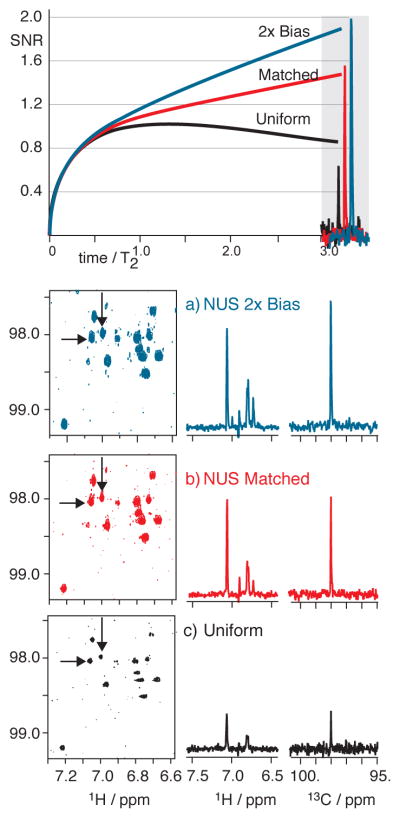
Figure 8.
1H(13C) HSQC spectra of 9 mg natural product spanning an evolution time of about 3 T2. Significant improvements in signal levels occur for matched or two-fold biased NUS as seen in panels (a–c): 9 hrs each, NUS selecting 400 of 1600 uniform samples. (US: 4 transients per sample; NUS:16 per sample). Contour levels are consistent in (a–c) so that as peaks grow in intensity from (a) to (c) the base of the peak rises above the noise, but the lines are not broadening. Inspection of the 13C cross-sections shows that line widths are not significantly changed from (a) to (c). The 13C cross-sections are overlaid at approximately the 3 T2 evolution period to show close correspondence to theoretical predictions.

