
Figure 4.
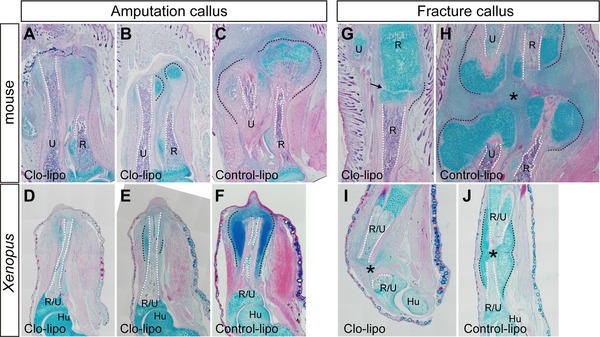
Formation of the amputation and fracture calluses in Clo‐lipo injected mice and Xenopus. Tissue sections were stained with hematoxylin and eosin and alcian blue. (A)−(F) Clo‐lipo injection results in inhibition of amputation calluses (A, B, D, E) in mice (7 dpa) (A−C) and Xenopus (10 dpa) (D−F), compared to controls (C, F). Two typical phenotypes are shown. In (A) and (D), no round‐shaped chondrocytes are found around the cut edge of the amputated bones. In (B) and (E), the size of the cartilaginous calluses is dramatically reduced. In Xenopus, the thickened epidermis is formed on the amputation plane in both strong inhibition phenotype (D) and reduced‐size phenotype (E), although a blastema is not formed. In a control limb (F), a small blastema already appears. (G)−(J) Clo‐lipo injection also inhibits formation of the fracture callus in mice (7 days) (G, H) and Xenopus (14 days) (I, J). (H), (J) Control‐lipo injected limbs. The granulation tissue between the broken bones is also dramatically reduced by Clo‐lipo injection (G, I). (A), (C), (G)−(J) Locally injected samples. (D)−(F) Intraperitoneally injected samples. Skeletal tissues are indicated; R, radius; U, ulna; R/U, radio‐ulna; Hu, humerus. The amputation calluses and the outline of the medullary cavity are delineated by black and white dotted lines, respectively. An arrow in (G) and an asterisk in (H) indicate the gap between the broken bones. Scale bar 500 μm.