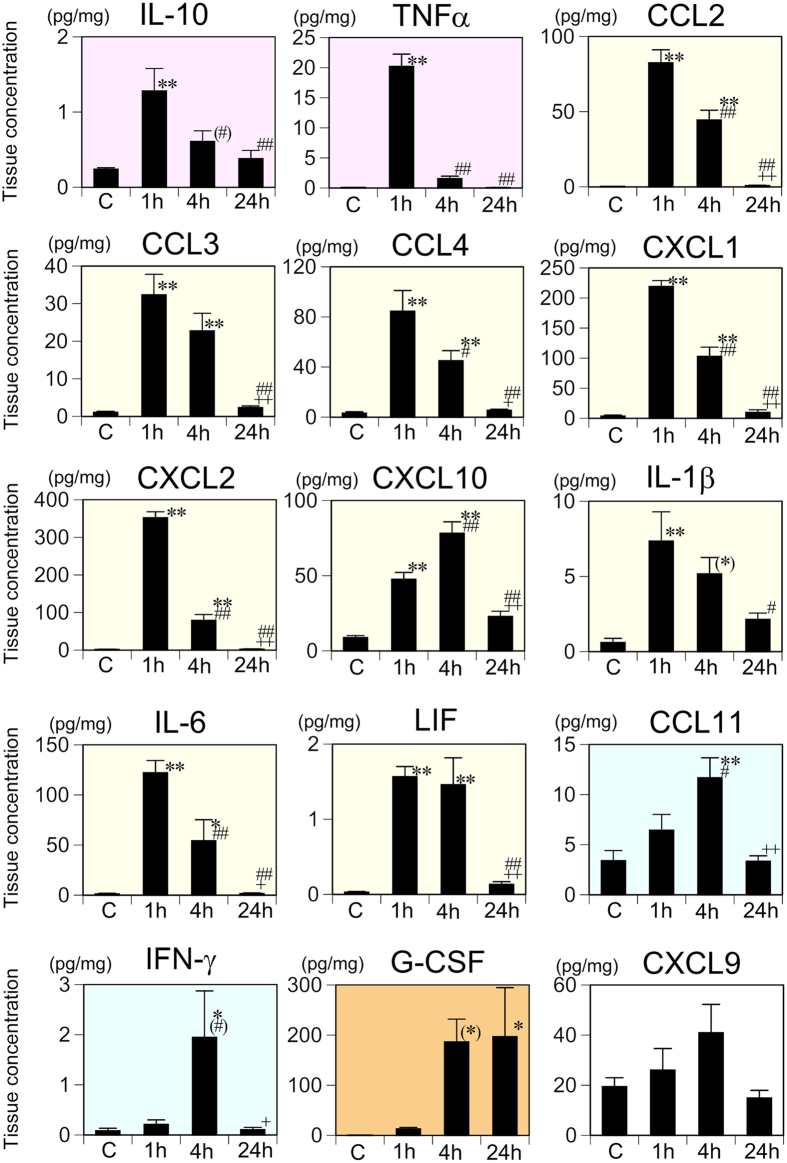
Figure 1. Changes in the splenic tissue concentrations of 15 cytokines following systemic LPS challenge.
Cytokine concentrations were measured with the multiplex assay and comparisons made among the saline control (C) and 1, 4, and 24 h following systemic LPS injection. Data were analyzed with one-way ANOVA followed by Tukey’s post hoc procedure. All cytokines were categorized into one of groups A–F according to the patterns of time-dependent changes in the tissue concentration (Table 3). Graphs for the group A cytokines are indicated with a pink background, group B with yellow, group C with blue, group D with orange, and group F with white. Mean ± SEM. For CCL2, IL-1β, and LIF, n = 5 per experimental group and for the other 12 cytokines, n = 7 for saline control and n = 5 for each LPS treatment condition. **p < 0.01, *p < 0.05, and (*)0.05 ≤ p < 0.06, compared with the saline control; ##p < 0.01, #p < 0.05, and (#)0.05 ≤ p < 0.06, compared with 1 h after LPS injection;++p < 0.01 and +p < 0.05, compared with 4 h after LPS injection.

