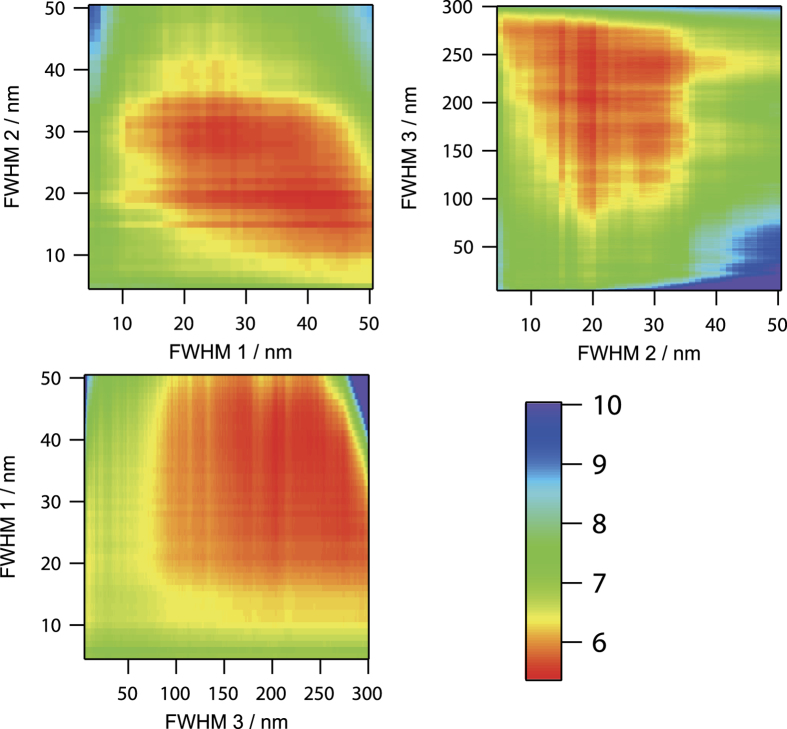
Figure 3. Computational simulation of standard estimation error of PPIX fluorescence intensity by varying the FWHMs of the observation wavelengths.
The observation center wavelengths were set at the optimum wavelength of 536, 634, and 745 nm. The minimum standard estimation error of PPIX fluorescence was 5.44 at the observation wavelengths of 536 nm with FWHM of 40 nm, 634 nm with FWHM of 20 nm, and 745 nm with FWHM of 204 nm. FWHM 1, FWHM 2, and FWHM 3 indicate the FWHM of observation wavelength 1, wavelength 2, and wavelength 3, respectively. Color bar represents standard estimation error.

