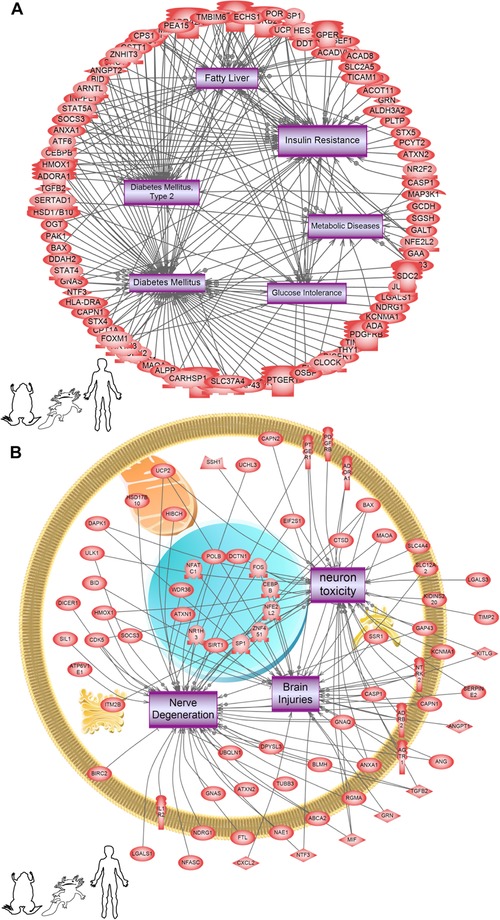
Figure 6.

Subnetwork enrichment analysis (SNEA) of all three (frog, axolotl, and human) datasets identifies regulated cell processes and diseases common in all three datasets that are involved in metabolic disease pathways. The pathways depicted are the ones mapped with axolotl genes, but these same processes and diseases were affected in both frog and human (i.e., the processes were common in all three). The specific genes from the frog and human datasets may be different but they affect the same cell processes and diseases. (A) metabolic disease pathways, and (B) brain‐related pathways within the “disease” database. Acronyms can be found in Appendix.
