
Fig. 2.
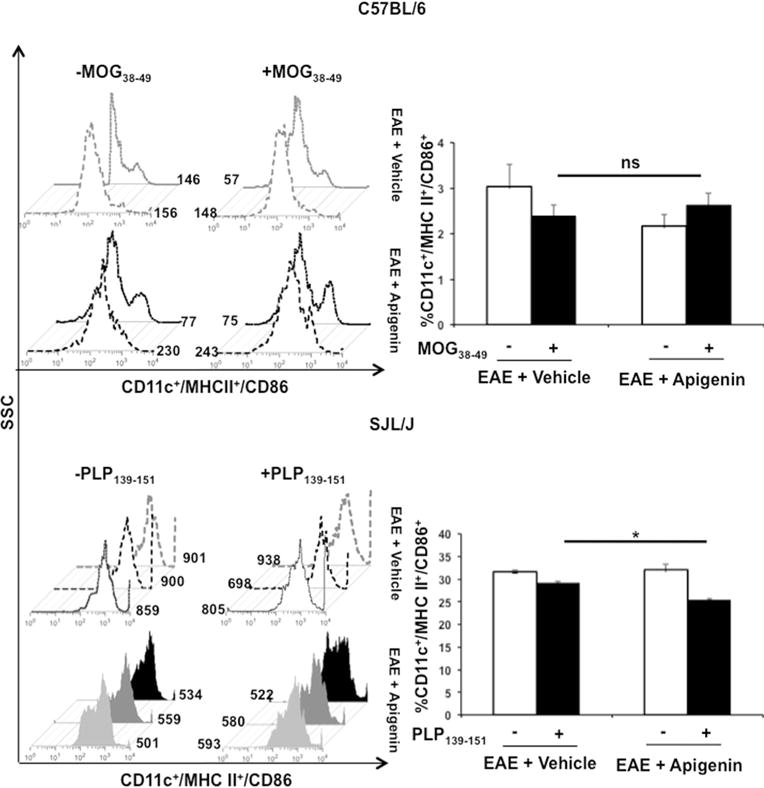
Effect of Apigenin on DC activation and antigen presentation. Splenocytes from both C57BL/6 and SJL/J mice (EAE + vehicle and EAE + Apigenin groups) were stimulated with MOG38–49 and PLP323–339 peptides respectively for 3 days followed by activation with PMA, ionomycin and brefeldin A for 5 h. These cells were subsequently stained with antibodies against CD11c, CD8α, MHC II, and CD86. Data represents CD11c+ dendritic cells from mice expressing MHCI I+CD86+ upon stimulation with MOG38–49 (top) and PLP323–339 (bottom). Each bar is representative of the mean percentage for every marker per group for both C57BL/6 (n=2/group) and SJL/J mice (n=5/group). Histogram plots are representative of one animal per group. *p<0.05