
Fig. 5.
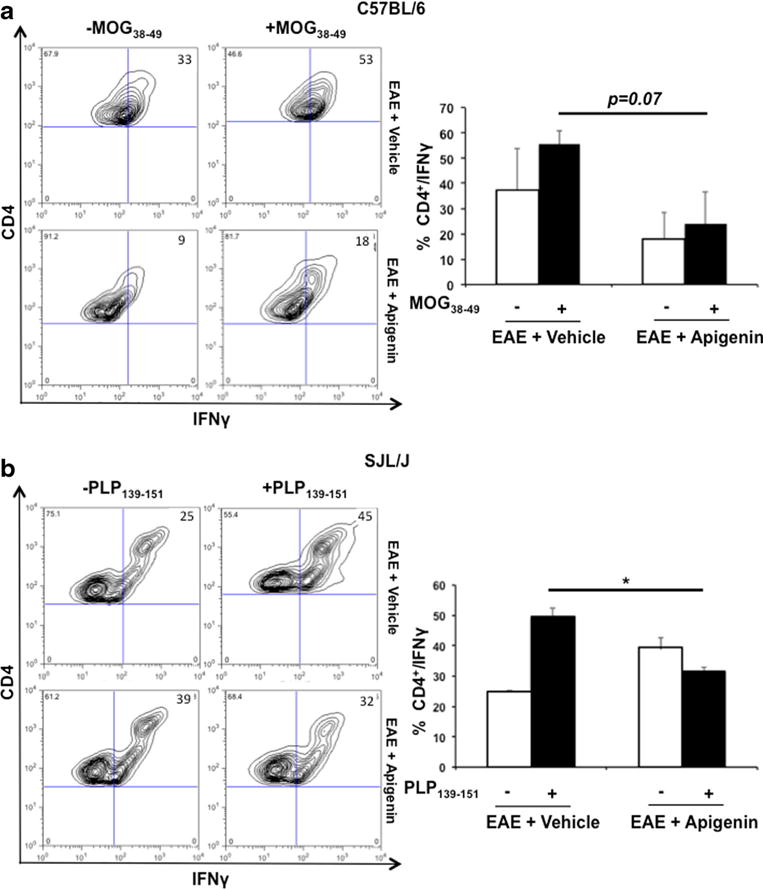
T cell functionality in the presence of Apigenin. Flow cytometry analysis representing CD4+ cells expressing IFN-γ in C57BL/6 mice upon stimulation with MOG38–49 a and SJL/J mice upon stimulation with PLP323–339 b. Splenocytes were isolated from mice in each group of C57BL/6 (n=2) and SJL/J (n=5) mice for quantifying and stimulating procedures. Each bar is representative of the mean percentage for every marker per group. Contour plots representative of one animal per group are shown on the left. *p<0.05