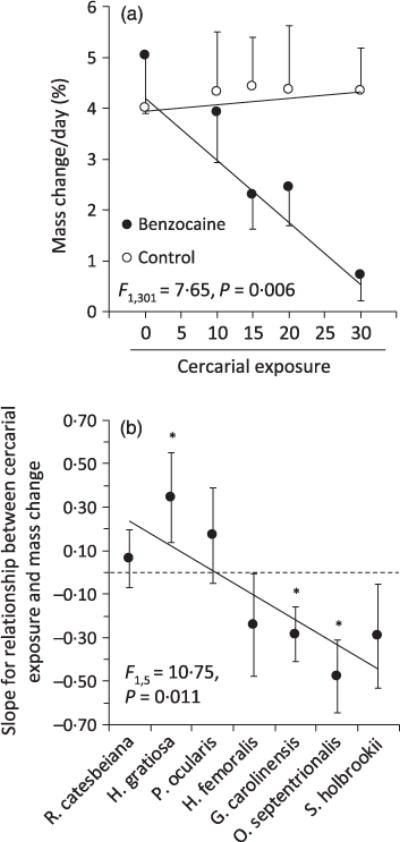
Fig. 3.

Tolerance of seven anuran species to cercarial exposure measured as the standardized slope of the relationship between cercarial exposure or attempted infections (when available) and mass change controlling for the number of actual infections. (a) Mean tolerance (±1 SE; averaging across the seven species) when tadpoles were or were not anaesthetized to control for anti-cercarial behaviours. Shown are back-transformed mean predicted values from a general linear model with log-positivized mass change as the response variable and species, anaesthesia treatment (continuous), and cercarial dose as predictors. (b) Mean tolerance (standardized slope ± 1 SE) of tadpole species arranged by tadpole pace-of-life, from slow (left) to fast (right). Asterisks indicate slopes that are significantly different from zero, and statistics listed are for the regression between the pace-of-life rank and the slope of mass change as a function of cercarial dose, weighting by the inverse of the variance estimate associated with each slope parameter (see Fig. A6 in Appendix S1 for individual scatterplots associated with each slope parameter).
