
Fig. 4.
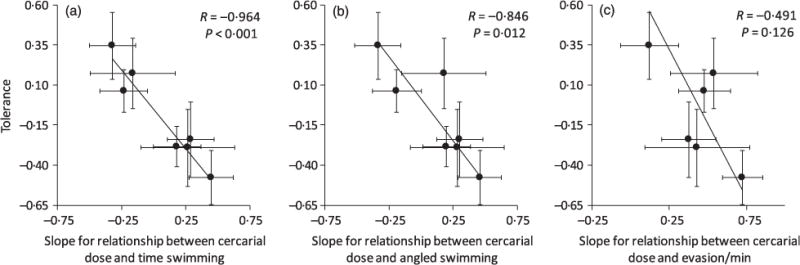
Negative relationships between tolerance of cercarial exposure in seven species of tadpoles and three measures of the strength of their behavioural resistance to cercariae: (a) total time spent swimming, (b) angled swimming, (c) anti-parasite evasion manoeuvres. Tolerance is defined as slope of the relationship between cercarial exposure or attempted infections (when available) and mass change controlling for the number of actual infections. Each point is the standardized slope (±1 SE) of the tolerance and resistance estimate, and the fitted lines and statistics are from weighted (by the inverse of the variance) major axis regression that minimizes the sums of squares of the perpendicular distance between each point and the regression line (to account for error in both the x and y variables). See Figs A3–7 in Appendix S1 for individual scatterplots associated with each slope parameter.