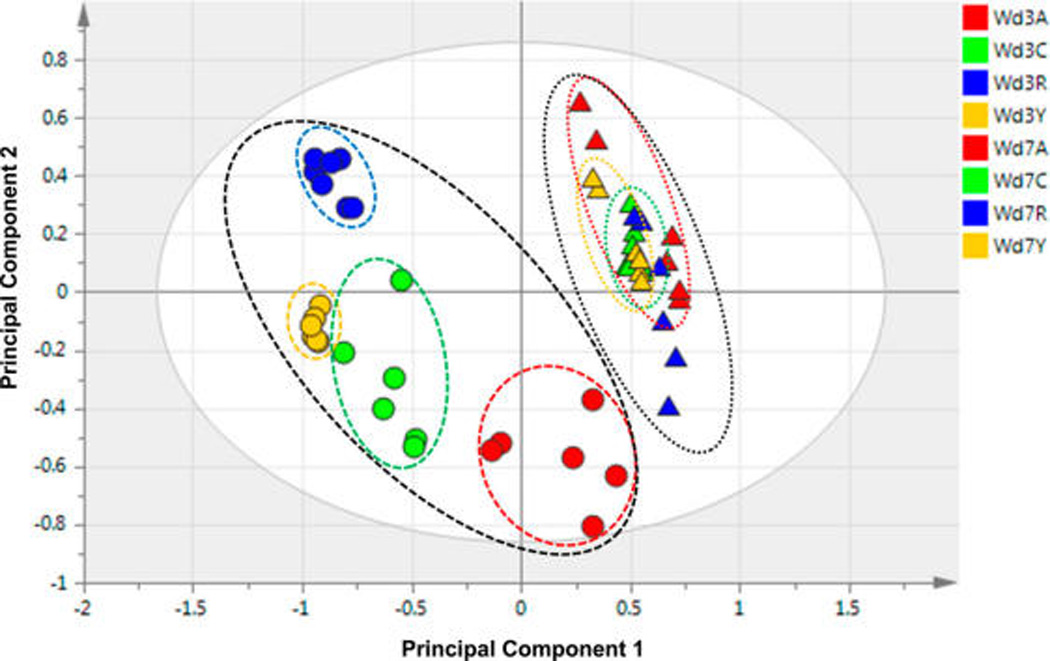
Figure 2.

PCA score plot of GC/MS data from nonpolar extracts, showing overall differences among the metabolite profiles for wound-healing samples of four cultivars at day 3 (circles) and day 7 (triangles). The samples are color-coded as Atlantic (red, A), Chipeta (green, C), Norkotah Russet (blue, R), and Yukon Gold (gold, Y) cultivars. The x and y axes of the plots represent the score values of principal components 1 and 2, respectively.
