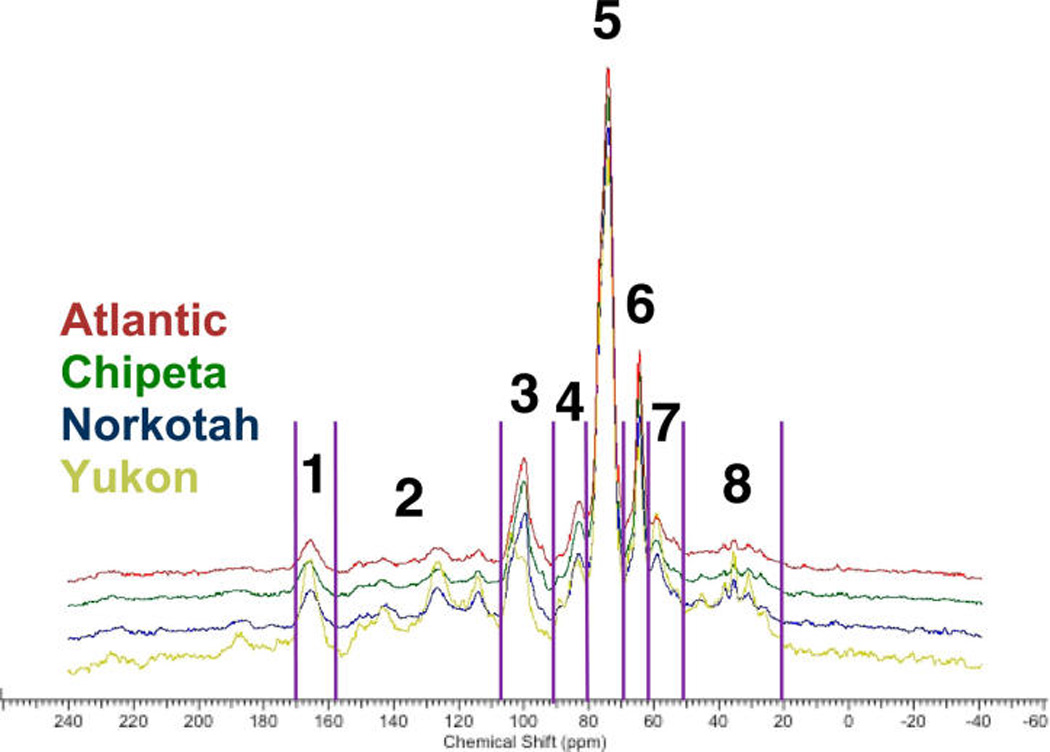
Figure 5.

Stacked multi-CP solid-state 13C NMR spectra of representative suberin-enriched tissue samples from each of the four cultivars at the day-7 post wounding time point, showing the chemical moieties present in the solid interfacial layer. The separated regions in the spectra are carboxyl and amide groups (168–180 ppm, region 1); arenes and alkenes (115–160 ppm, region 2); alkoxy groups (96–108, 80–92, 67–80, 59–67 ppm; regions 3–6); methoxy groups (45–59 ppm, region 7); and alkyl chain methylenes (15–45 ppm, region 8). Each spectrum was normalized by setting the largest peak to full scale.
