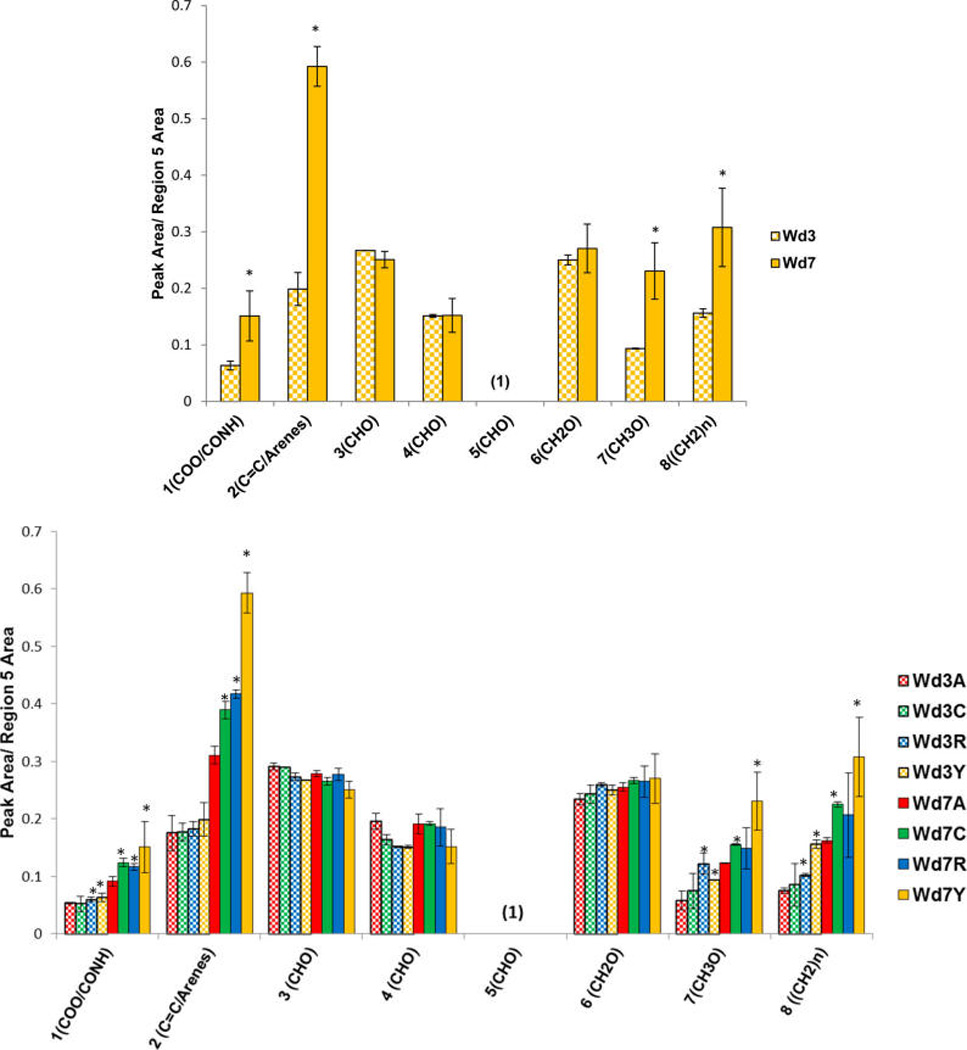
Figure 6.

Peak ratios from 150 MHz multi-CP MAS 13C NMR spectra for the solid interfacial layer from suberin-enriched potato wound-healing samples of the Yukon Gold cultivar (top) and all four cultivars (bottom) at days 3 (Wd3) and 7 (Wd7) postwounding, calculated with respect to the major polysaccharide CHO peaks in region 5 (67–80 ppm). The samples are coded for Atlantic (red, A), Chipeta (green, C), Norkotah Russet (blue, R), and Yukon Gold (gold, Y). The data represent the mean ± standard error of the mean of two biological replicates. Asterisks (*) are used to denote the most significant differences in peak area ratio with respect to day 3 (top) and with respect to Atlantic at any wounding time point (bottom) (P < 0.05, from Tukey pairwise comparisons).21
