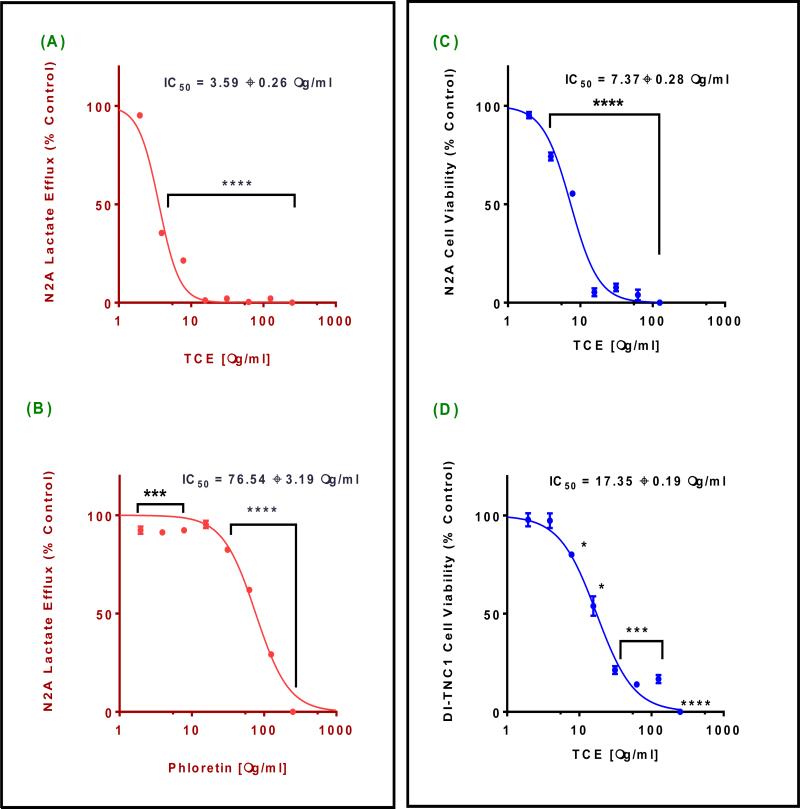
Fig. 2. Effect of Terminalia chebula (TCE) on lactate efflux and cell viability.
(A) and (B) are lactate production profile of N2-A cells after 4 h exposure to different concentrations of TCE and phloretin, respectively. (C) and (D) are cytotoxicity profile of N2-A and DI-TNC1 cells after 24 h exposure period to different concentrations of TCE. Statistical analysis of all studies was presented as the mean ± SEM from the average of two independent experiments, n=4 each. IC50s are average of two independent studies sigmoidal curves. The significance of the difference between controls vs. treated cells was determined using a one-way ANOVA followed by Dunnett's multiple comparisons test. Significance of difference between control and treatment is considered at *P = 0.05, *** P = 0.001, and **** P = 0.0001

