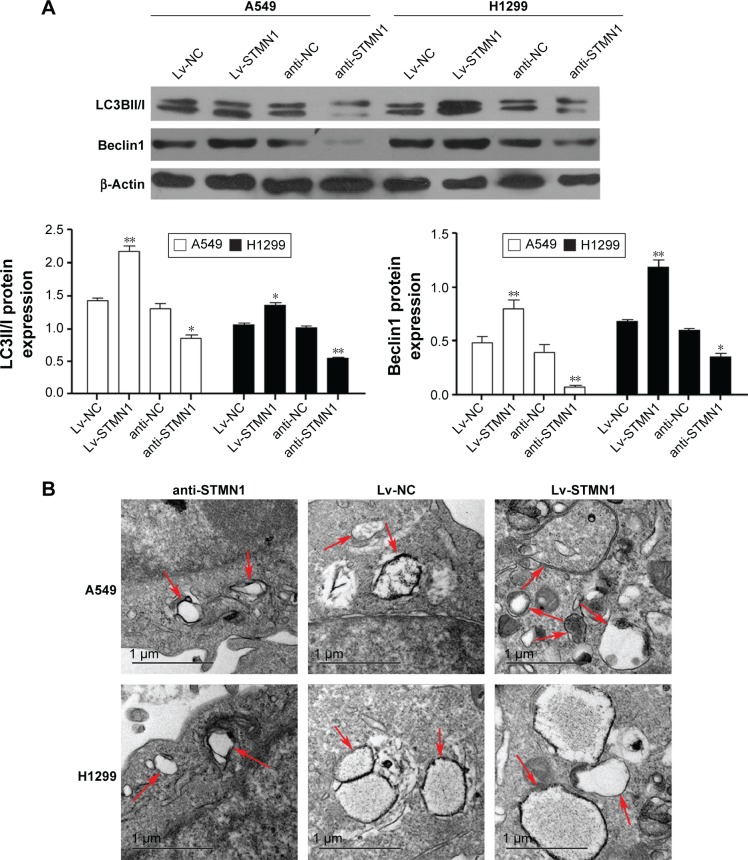
Figure 3.
STMN1 regulated autophagy in A549 and H1299 cells.
Notes: (A) The protein expression level of Beclin1 and LC3II/I in STMN1-up/downregulating of A549 and H1299 cells, which were treated with X-ray irradiation at 2 Gy. (B) Autophagosome-like structures (indicated by the red arrows) were assayed by TEM. Data presented as mean ± SD, *P<0.05, **P<0.01.
Abbreviations: anti-NC, the control of loss models; anti-STMN1, STMN1 loss model; Lv-NC, the control of gain models; Lv-STMN1, STMN1 gain model; STMN1, Stathmin1; SD, standard deviation; TEM, transmission electron microscopy.

