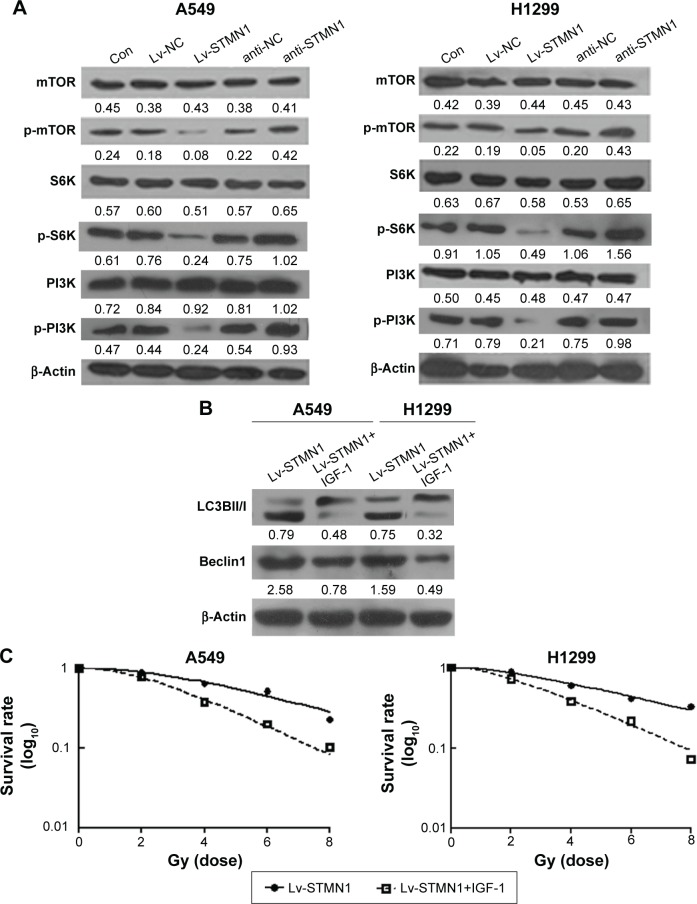
Figure 4.
STMN1 regulated the autophagy ability through P13K/mTOR pathway in A549 and H1299 cells.
Notes: (A) Western blot analyzed the protein expression levels of mTOR and PI3K signal pathway in STMN1-up/downregulating of A549 and H1299 cells, which were treated with X-ray at 2 Gy. (B) Western blot analysis of LC3-1 and LC3-II, Beclin1 expression in STMN1-overexpressing A549 and H1299 cells treated with or without IGF-1, when they subjected to X-ray in 2 Gy. (C) And the clonogenic cell survival assay was conducted. Data presented as mean ± SD.
Abbreviations: con, control; anti-NC, the control of loss models; anti-STMN1, STMN1 loss model; IGF-1, insulin-like growth factor-1; Lv-NC, the control of gain models; Lv-STMN1, STMN1 gain model; mTOR, mammalian target of rapamycin, p, phosphorylation; STMN1, Stathmin1; SD, standard deviation.

