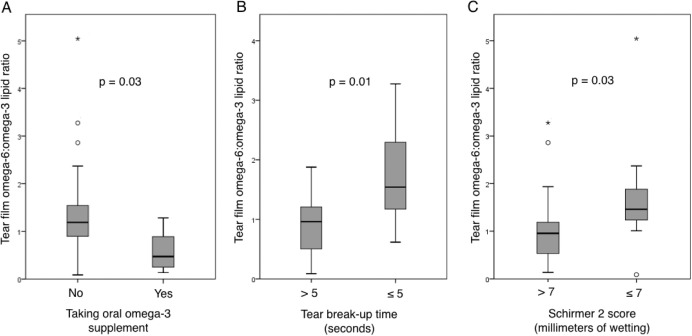
Figure 2.
Box-and-whisker plots comparing tear film ω-6:ω-3 lipid ratios in patients with and without (A) use of ω-3 supplements (0.58 ± 0.43 vs. 1.37 ± 0.96; P = 0.03), (B) evaporative deficiency defined by TBUT ≤ 5 seconds (1.89 ± 1.24 vs. 0.87 ± 0.47; P = 0.01), and (C) aqueous tear deficiency defined by Schirmer 2 score ≤7 mm (1.70 ± 1.20 vs. 1.02 ± 0.74; P = 0.03). Gray boxes represent the interquartile range between the 25th to 75th percentile, middle line represents the median, and vertical line extends from the minimum to the maximum value, excluding outliers (open circles represent values larger than the upper quartile plus 1.5 times the interquartile range; asterisks represent values larger than the upper quartile plus 3 times the interquartile range).

