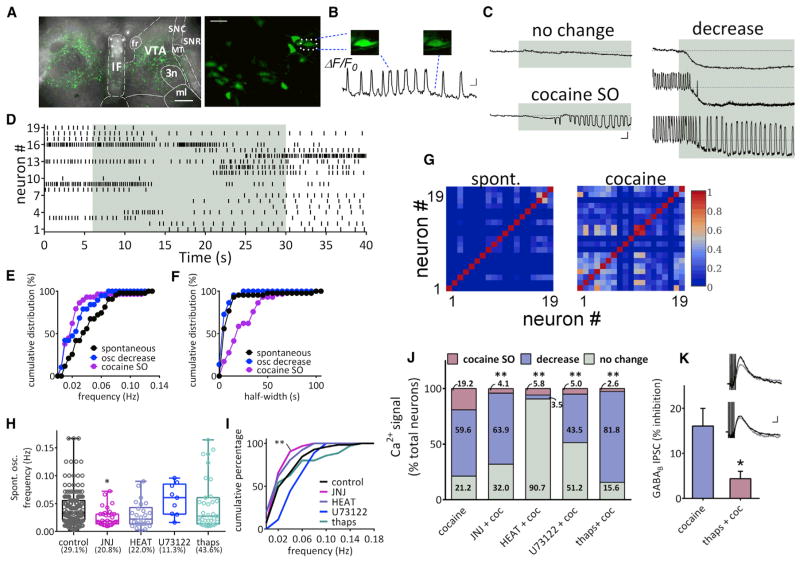
Figure 6. Cocaine-Induced Calcium Changes in VTA DA Neurons.
(A) Superimposed fluorescent and transmitted light images showing the expression of GCaMP6f in VTA DA neurons 2–3 weeks after injection of the AAV-GCaMP6f construct. Scale bar, 500 μm.
(B) Spontaneous slow calcium oscillations in VTA DA neurons. Left: confocal image of the GCaMP6f signal (200×). Scale bar, 50 μm. Right: example calcium oscillations (ΔF/F0) in the same cell indicated in the dashed square at left. Scale bar, 30 s, 20%.
(C) Sample traces of calcium signals (ΔF/F0) in response to cocaine application (10 μM, indicated in gray). Three types of changes were observed: no change, a decrease in spontaneous oscillations, and the initiation of slow oscillations (SO).
(D) Raster plot of oscillation events in 19 neurons imaged as in (B). Each vertical bar denotes the peak of an oscillation event. Each row exhibits the time course of oscillation change in single neurons.
(E) Cumulative frequencies of spontaneous, cocaine-decreased, and cocaine-initiated slow oscillations (cocaine SO) in calcium signal. The curve shifts left to slower frequencies in neurons whose calcium oscillations were decreased by cocaine (osc decrease versus spontaneous, p = 0.17, K-S test). The frequency of cocaine-initiated SO was significantly lower than that of spontaneous oscillations (cocaine-initiated versus spontaneous, p < 0.01, K-S test). Spontaneous oscillation, n = 43 neurons; oscillation decrease, n = 19 neurons; cocaine SO, n = 29 neurons recorded in eight brain slices from six rats.
(F) Cumulative distribution of half-widths of spontaneous, cocaine-decreased, and cocaine-initiated SO. Cocaine-initiated SO exhibit longer half-widths than spontaneous oscillations. (cocaine SO versus spontaneous, p < 0.0001, K-S test). Spontaneous oscillation, n = 43 neurons; oscillation decrease, n = 19 neurons; cocaine SO, n = 29 neurons recorded in eight brain slices from six rats.
(G) Increased correlation of calcium responses among neurons (same 19 neurons as D) during cocaine perfusion. Cross correlations among all neuron pairs were calculated, and the peak correlation coefficient (r = 0 to 1) is color-coded to form the heat map. The data indicate that VTA DA neuron calcium oscillations are more highly synchronized by cocaine.
(H) Cocaine-induced calcium oscillations depend on mGluR1, α1-adrenergic receptors, and internal calcium stores. The frequency of spontaneous calcium oscillations is reduced by JNJ16259685 (500 nM), but is not altered by HEAT (1 μM), U73122, or thapsigargin (thaps, 2 μM), respectively (F(4,265) = 3.806, p = 0.005, one-way ANOVA; control versus JNJ: p < 0.05, Bonferroni post hoc analysis). Each point represents the frequency of spontaneous Ca2+ oscillation from one neuron; the box and vertical lines indicate quartiles, minimal, and maximal frequencies. The percentage of neurons exhibiting spontaneous oscillations is shown for each treatment group.
(I) Cumulative distributions of the frequencies of spontaneous oscillations are only affected by JNJ (p = 0.0037, Kolmogorov–Smirnov test).
(J) Summary of the percentage of DA neurons responding to cocaine under control, JNJ16259685, HEAT, U73122, and thapsigargin treatments. Numbers denote the percentage of neurons demonstrating indicated changes upon cocaine treatment. All treatments decreased the cocaine-induced Ca2+ oscillation.

