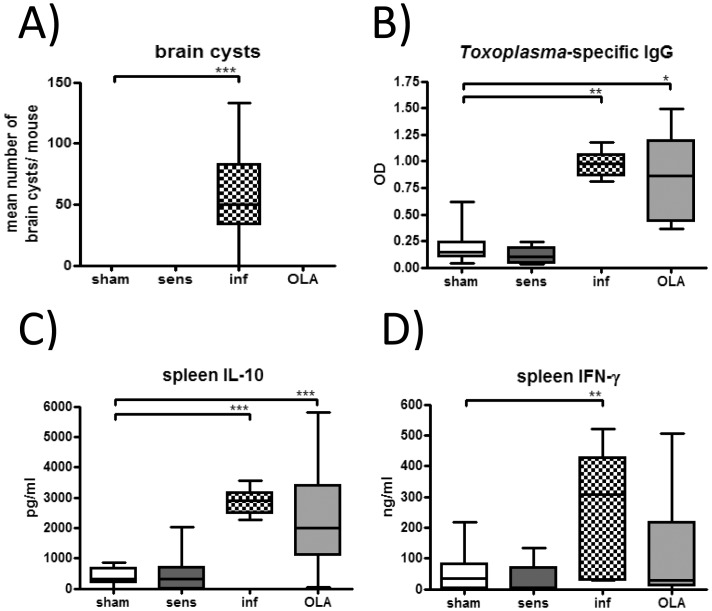
Fig 4. Brain cyst counts and parasite-specific antibody and cytokine production.
Brain cysts were counted on day 49 (A). Results represent pooled values from two independent experiments with four to eight mice per group. Toxoplasma-specific IgG antibodies were measured in sera (B). IL-10 (C) and IFN-γ (D) production was determined in Toxoplasma-stimulated splenocytes in vitro. Spleens and sera were sampled on day 49. Results represent pooled values from three independent experiments with four to eight mice per group. * p < 0.05; ** p < 0.01; *** p < 0.001.

